

Switch Health Alerts
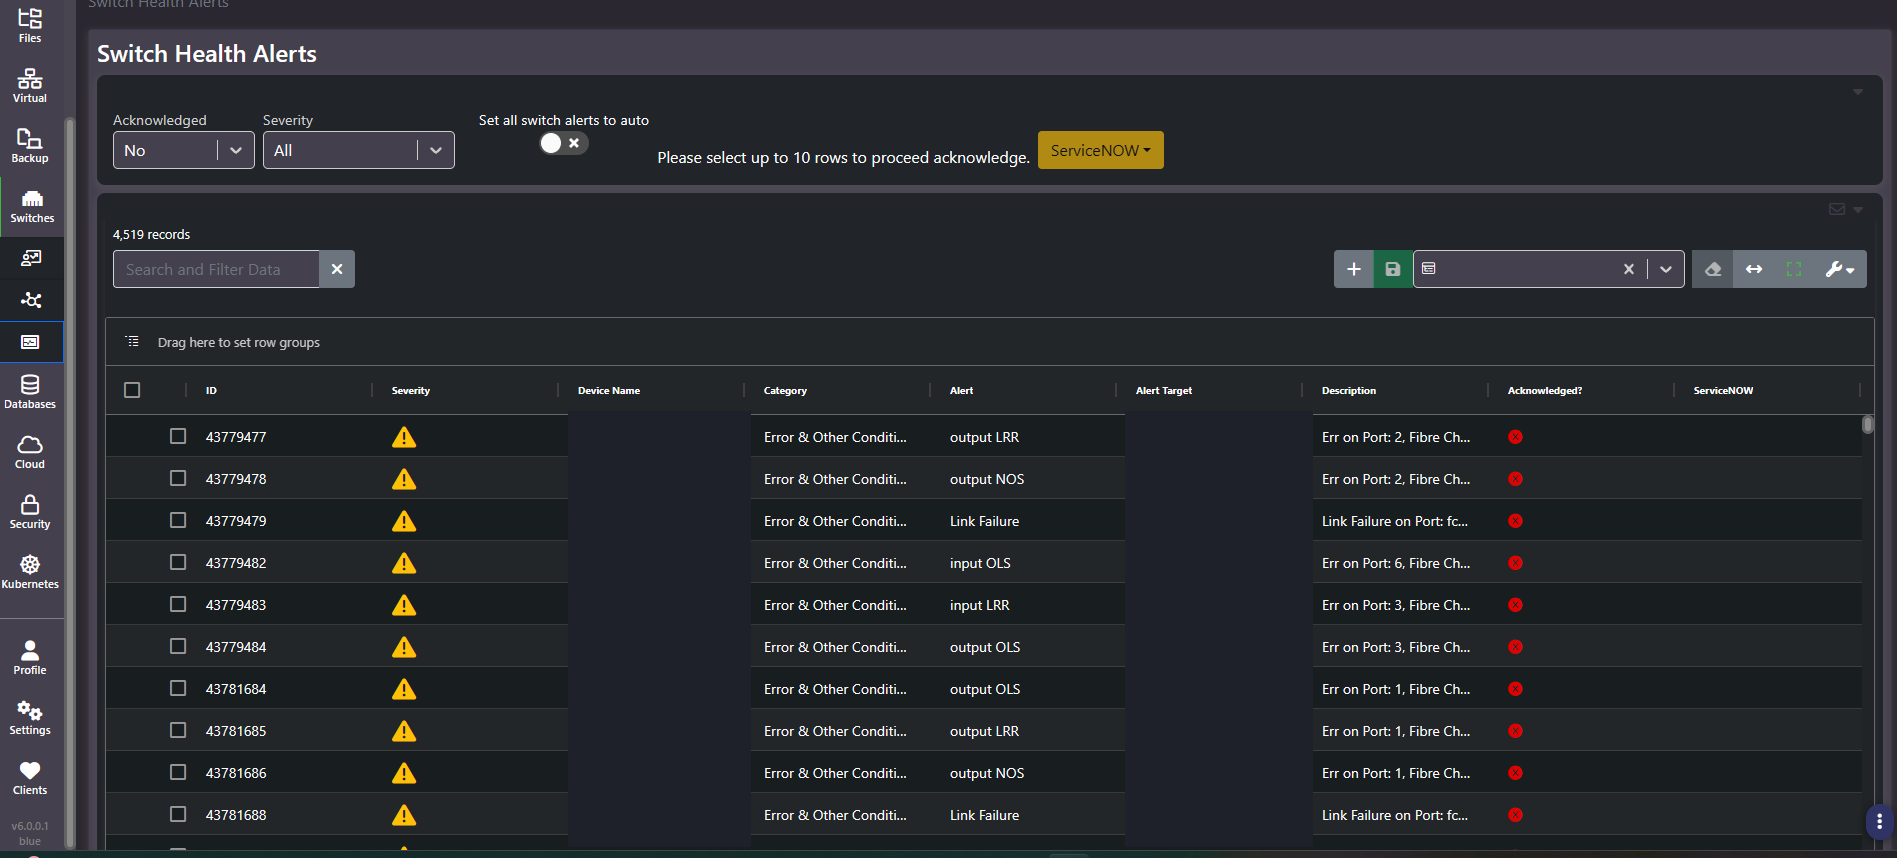
Purpose: Which switch and which port. Every fabric alert with its severity, category, alert type, and target port, using the same acknowledgment, auto-acknowledge, and ServiceNow model as the other alert screens.
When to use it
- Locate the specific switch and port behind a rising error count
- Establish whether errors are concentrated on one device or spread across the fabric
- Produce a port list for someone to inspect optics and cabling against
- Escalate a fabric problem into an incident with its context intact
Key areas and metrics
| Column | What it holds |
|---|---|
| ID | Numeric alert identifier |
| Severity | Shown as an icon |
| Device Name | The switch that raised it |
| Category | The condition class, for example errors and other conditions |
| Alert | The fibre channel condition, for example link failure or an input or output primitive sequence error |
| Alert Target | The specific port the condition applies to |
| Description | The detail, naming the port and channel |
| Acknowledged? | Current acknowledgment state |
| ServiceNOW | Per-row escalation state |
Controls match the other alert screens: acknowledged and severity filters, a Set all switch alerts to auto toggle, row selection with a ten-row acknowledgment cap, a ServiceNow menu, and the standard grid with search and row grouping.
One port produces many alerts
A single failing port generates a cluster of different alert types together, because the failure modes cascade. A degraded optic loses signal lock, which fails the link, which triggers a reset, which produces primitive sequence errors in both directions. Each is reported separately.
So a record count in the thousands does not mean thousands of problems. Group by Alert Target and the same queue usually collapses to a handful of ports, which is the actual worklist. Doing that before reading rows is the difference between an afternoon and a week.
Common actions
- Group by Alert Target first. It converts an alert flood into a port list.
- Then group by Device Name to see whether the affected ports share a switch, which points at the switch rather than the optics.
- Hand the port list to whoever can inspect the physical layer. Most conditions here are cables, connectors, and optics.
- Acknowledge only after the port has been remediated and the next collection confirms it.
Tips
Auto-acknowledge is a poor fit for this screen. Fabric alerts arrive in volume from a small number of physical faults, so suppressing them hides the fault rather than the noise. Group instead.
Related screens
Enterprise SAN Switch Summary shows whether these alerts are increasing in aggregate. Host LUNs shows which LUNs are affected by a faulty port. Storage Health Alerts covers the array end of the same path.