

IT Dashboard
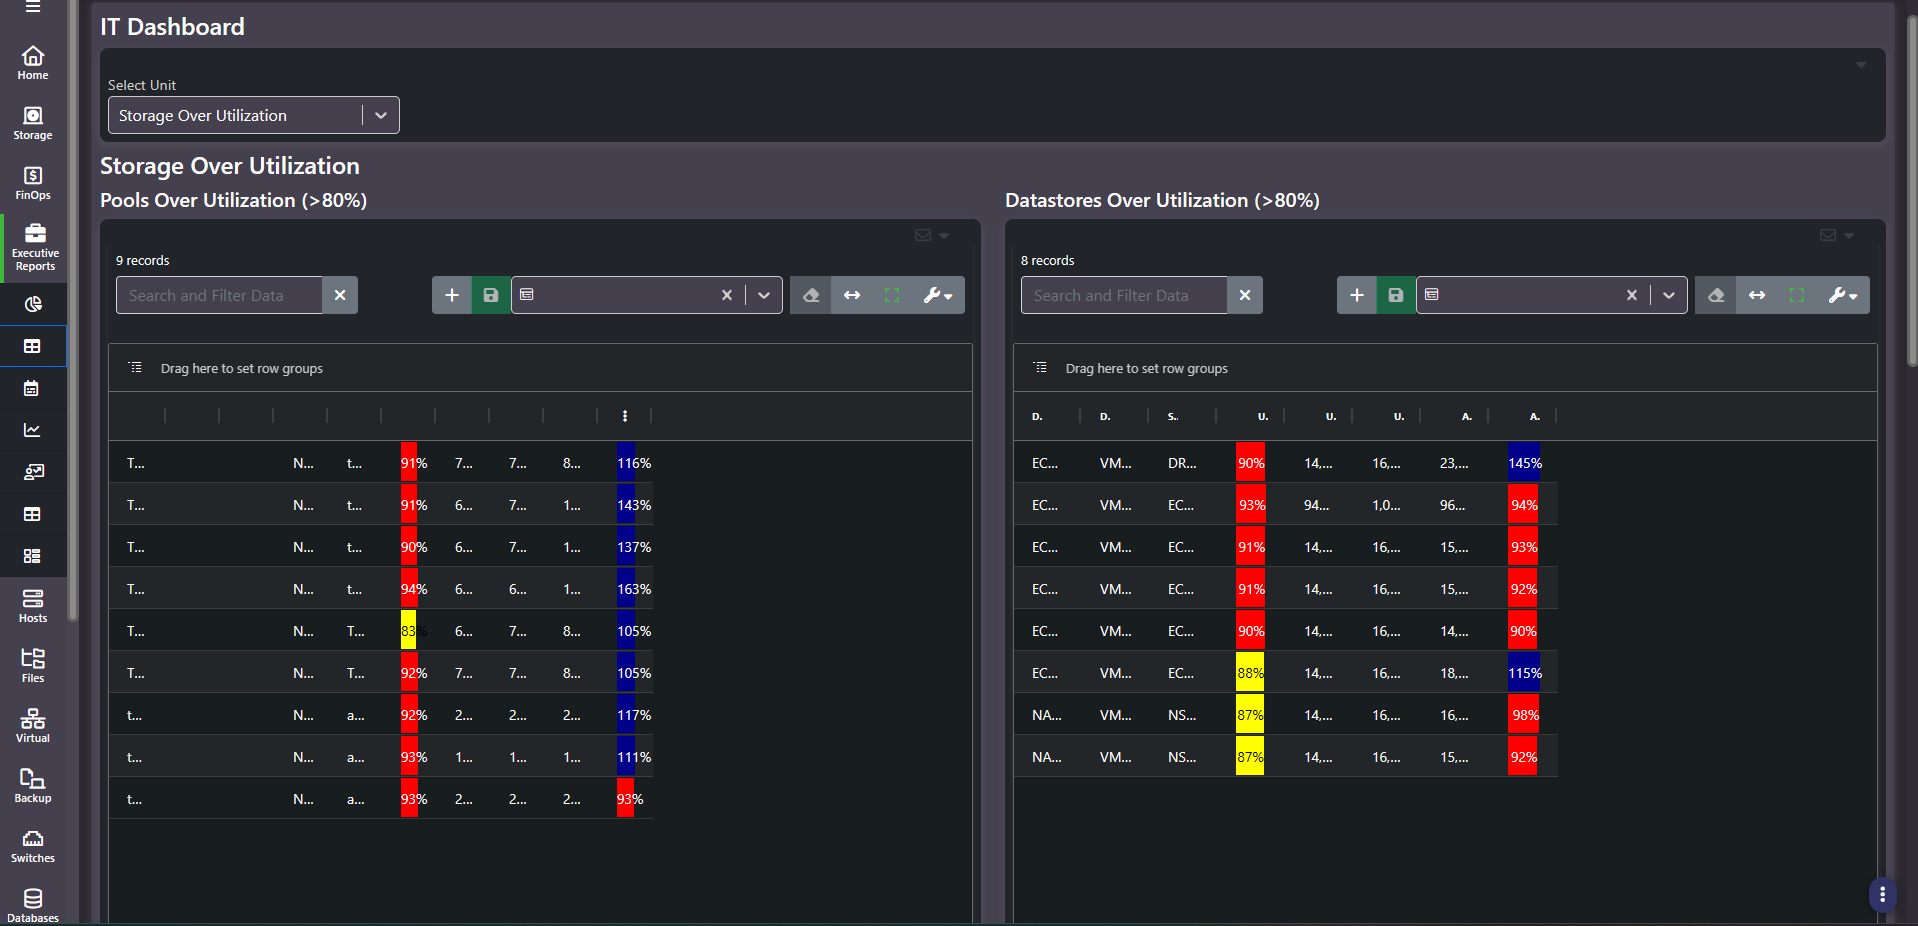
Purpose: The exception list. Everything currently breaching a utilization or allocation threshold, and nothing else. It is deliberately the shortest screen in the section, because a short list is what actually gets worked.
When to use it
- Open a weekly or monthly operations review with a concrete worklist
- Find pools and datastores approaching physical capacity before anyone is paged
- Quantify thin-provisioning exposure across the estate
- Decide whether a capacity request is genuine or an allocation-discipline problem
Key areas and metrics
A Select Unit dropdown at the top chooses the exception set; the section heading and panels below change to match. With Storage Over Utilization selected, four grids render as two pairs.
| Panel | Threshold | What it means |
|---|---|---|
| Pools Over Utilization | Above 80% | Storage pools genuinely close to full |
| Datastores Over Utilization | Above 80% | Datastores genuinely close to full |
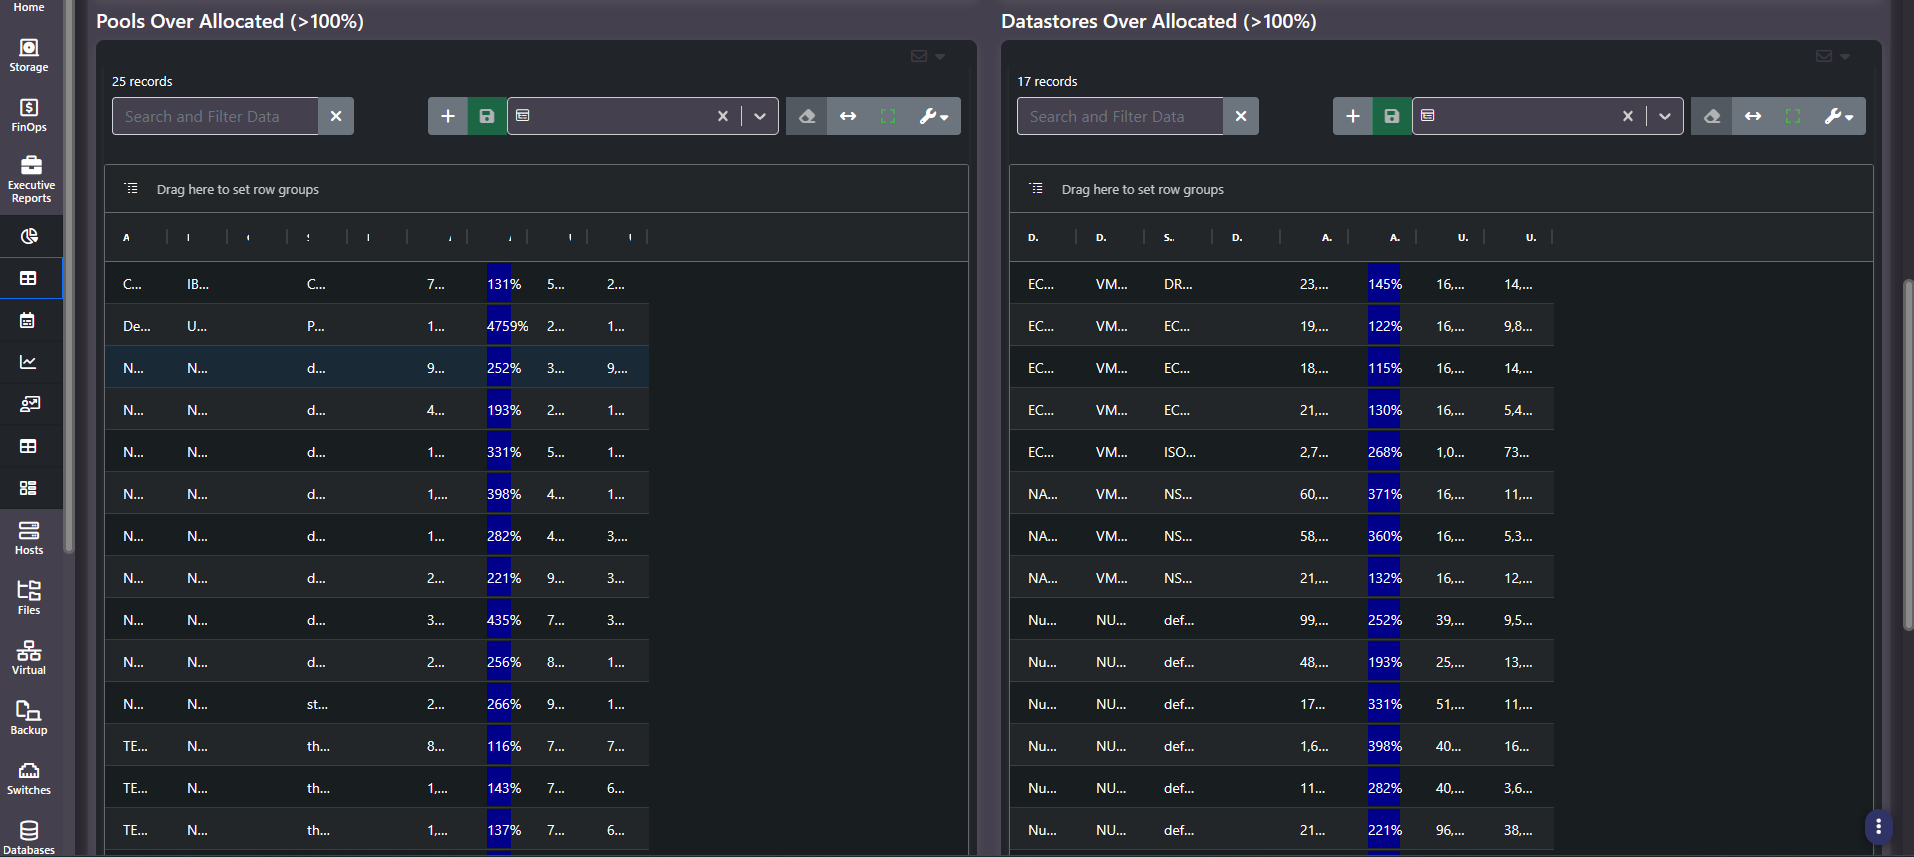
| Pools Over Allocated | Above 100% | More capacity promised than the pool physically has |
| Datastores Over Allocated | Above 100% | More capacity promised than the datastore physically has |
Every panel carries its own record count and the standard analytical grid: search and filter, saved column settings, clear filters, fit columns, full screen, a settings menu, and a drag zone for row grouping. Percentage cells are shaded by severity, with distinct colours for approaching a threshold, breaching it, and exceeding 100%.
Utilization and allocation are different problems
This is the distinction the screen exists to make, and conflating the two leads to buying hardware you do not need.
- Over-utilized means the capacity is actually consumed. The runway is real and short. The fix is more capacity, migration, or reclamation.
- Over-allocated means capacity has been promised through thin provisioning but not yet consumed. Nothing is wrong today. It becomes wrong the moment consumers grow into their allocations at the same time.
The over-allocation grids routinely run far longer than the over-utilization grids, and individual figures can reach several hundred percent or more. That is normal for a thin-provisioned estate. What matters is which objects are over-allocated and climbing in utilization, because those are the ones where the promise is about to be called in.
Common actions
- Work over-utilization first. It is the shorter list and the one with real risk attached.
- Cross-reference the two sets. An object appearing in both is the genuine priority.
- Autosize or full-screen the grid. Columns default narrow enough to truncate names, so widen before trying to identify a specific object.
- Group by device or cluster. Exceptions concentrated on one array or one cluster point to a single root cause rather than an estate-wide problem.
Tips
An empty over-utilization panel is the goal, not a broken screen. Do not go looking for a different unit selection to fill it.
Check the Select Unit dropdown before concluding the dashboard only covers storage. The panels below it are scoped entirely by that selection.
Related screens
Free Space by Group shows whether free capacity exists where the constrained pools need it. All Units: Datastores is the operational view of the datastore exceptions. Enterprise Capacity Plan turns an over-utilized pool into a dated forecast.