

Cost Per Sector Report
Cost Per Sector is the only FinOps report that carries a budget. Every other screen describes what infrastructure costs. This one compares that cost to what you said it would cost, sector by sector.
What this screen shows
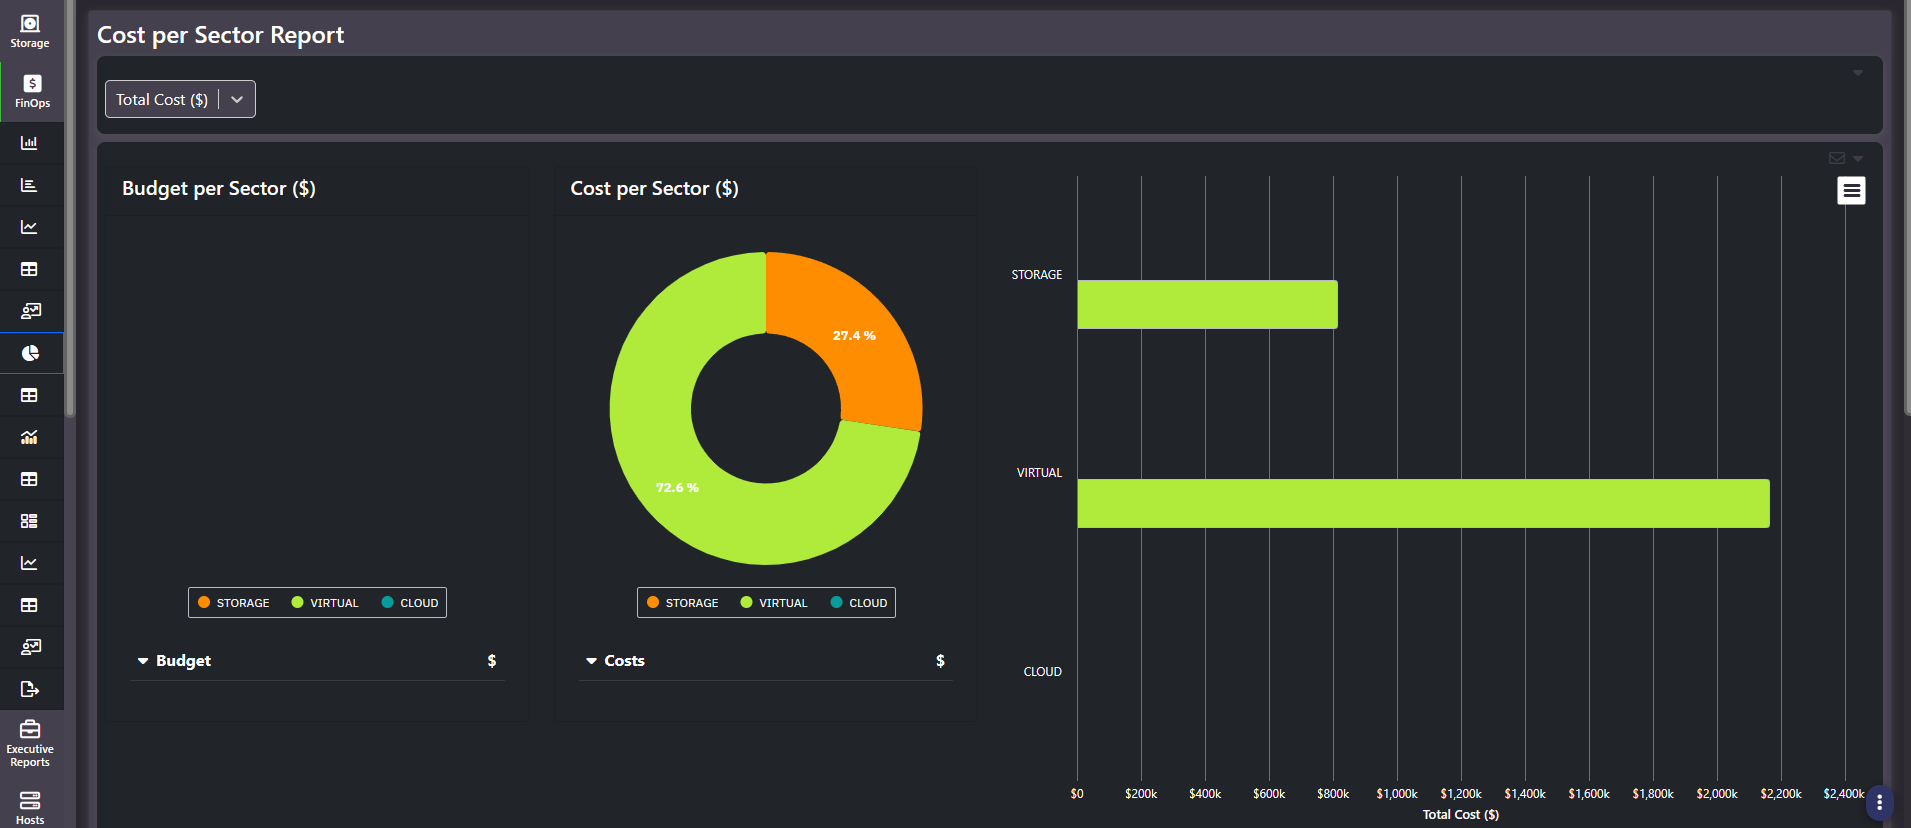
Three visualizations of the same three sectors, Storage, Virtual, and Cloud, plus a grid.
- Budget per Sector. A donut showing how the budget was allocated across the three sectors.
- Cost per Sector. A second donut, same shape, showing how actual spend actually distributed.
- Total Cost. A horizontal grouped bar chart with a budget bar and a cost bar per sector, which is where over and under budget become obvious at a glance.
The two donuts are meant to be read against each other. When a sector’s slice of actual cost is materially larger than its slice of budget, the plan and reality have diverged, and the grouped bar chart tells you by how much.
The grid
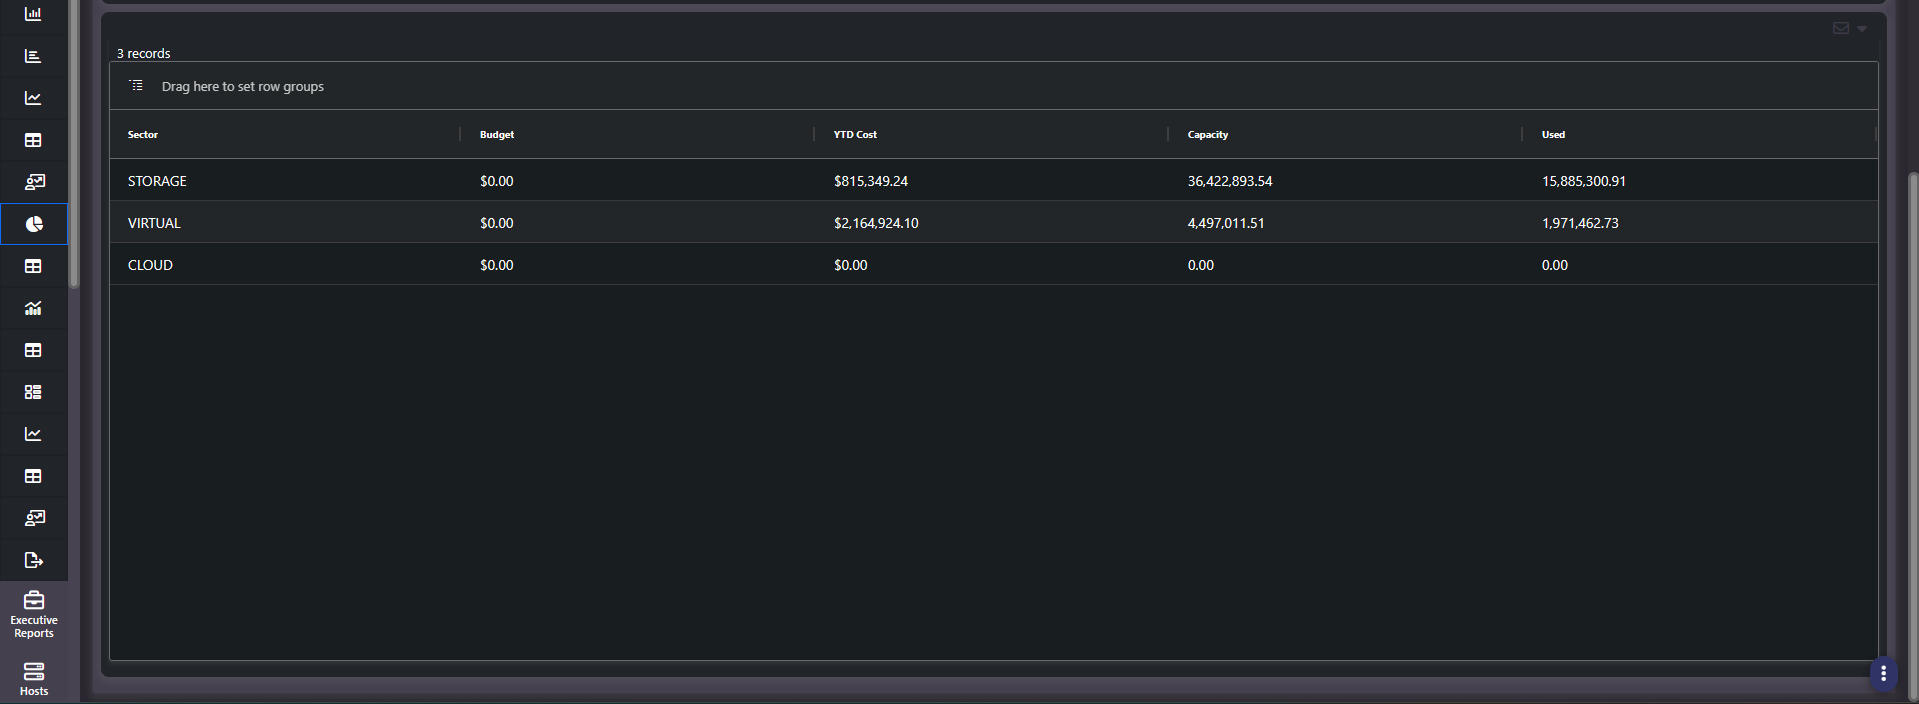
| Column | What it tells you |
|---|---|
| Sector | Storage, Virtual, or Cloud |
| Budget | The allocation set during planning |
| YTD Cost | Actual spend so far this year |
| Capacity | Total capacity available in the sector |
| Used | How much of that capacity is consumed |
Capacity and Used sitting next to Budget and Cost is what makes this report useful rather than merely accurate. A sector over budget with high utilization is a forecasting miss. A sector over budget with low utilization is a buying decision that has not paid off, and it is a very different conversation.
How to work a variance
- Over budget, high utilization. Demand grew faster than the plan. Take it to capacity planning and revise the forecast.
- Over budget, low utilization. Cost is going somewhere that is not producing usable capacity. Start with the savings and efficiency screens.
- Well under budget. Usually a project that did not land, or a sector where costs have not been fully onboarded yet. Verify collection coverage before celebrating.
Budgeting as a practice
This is the budgeting screen, and the split of responsibility around it is usually three-way: finance sets the limits, leadership holds the accountability for them, and the practitioner monitors against both. The variance percentage per sector is the shared number all three work from.
The value is in the timing rather than the arithmetic. A sector running over budget shows up here while there is still a quarter left to react, instead of arriving as a surprise in a quarterly review. Surfacing the variance early is the entire point of carrying a budget in the platform at all.
Related screens
Cost YTD gives the month-by-month path the annual figure took. Cost Efficiency Dashboard answers whether the spend is earning its keep. Savings Report is the fastest route to closing an overrun.