

Enterprise Databases Summary
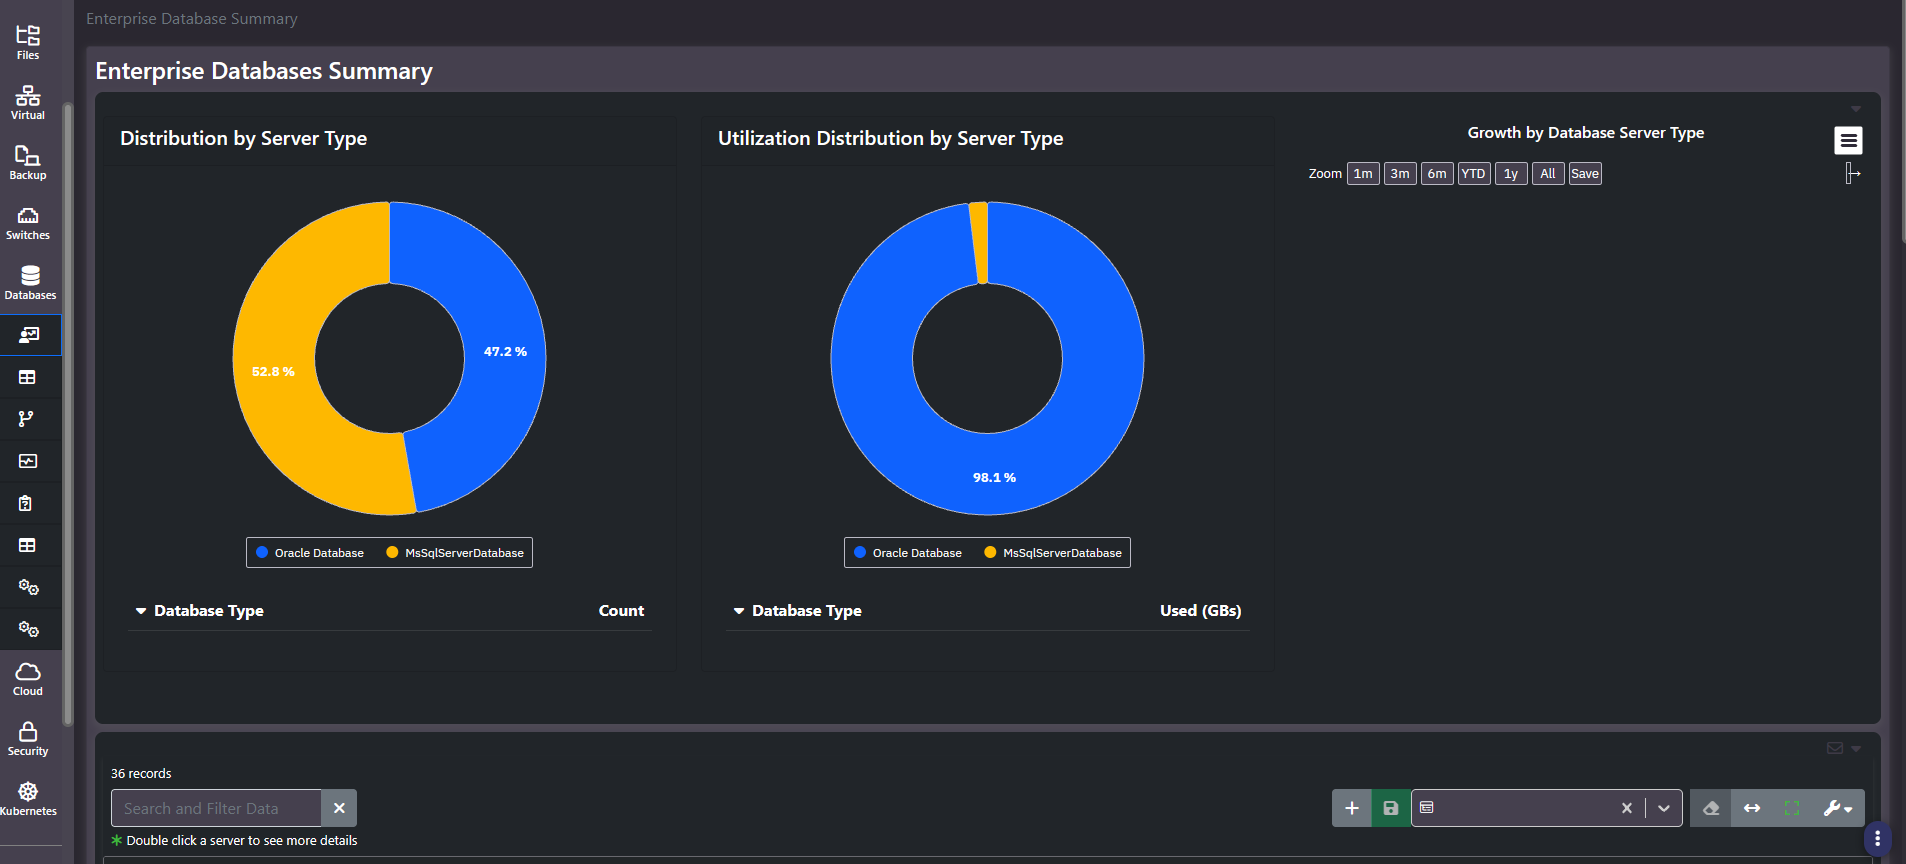
Purpose: The database estate at a glance. Two donuts splitting the estate by platform, one by instance count and one by capacity consumed, plus a growth chart and an instance grid. The two donuts read against each other are the point of the screen.
When to use it
- Answer how the estate splits between database platforms
- Find the instances closest to capacity
- Check version spread against a patching programme
- Establish which platform is actually driving storage consumption
Key areas and metrics
| Panel | Measure | Footer |
|---|---|---|
| Distribution by Server Type | Number of instances per platform | Database Type / Count |
| Utilization Distribution by Server Type | Capacity consumed per platform | Database Type / Used (GBs) |
| Growth by Database Server Type | Consumption over time per platform | Zoom presets, save, and export controls |
Count and capacity tell opposite stories
These two donuts are deliberately adjacent because they routinely disagree. An estate can be close to evenly split by instance count while one platform holds almost all the capacity, which is the normal pattern where SQL Server is used widely for small application databases and Oracle carries a handful of large systems of record.
That difference changes decisions. Licensing and administrative effort scale with instance count. Storage cost, backup windows, and capacity planning scale with the capacity donut. Quoting one where the other applies is the most common mistake made from this screen.
The instance grid
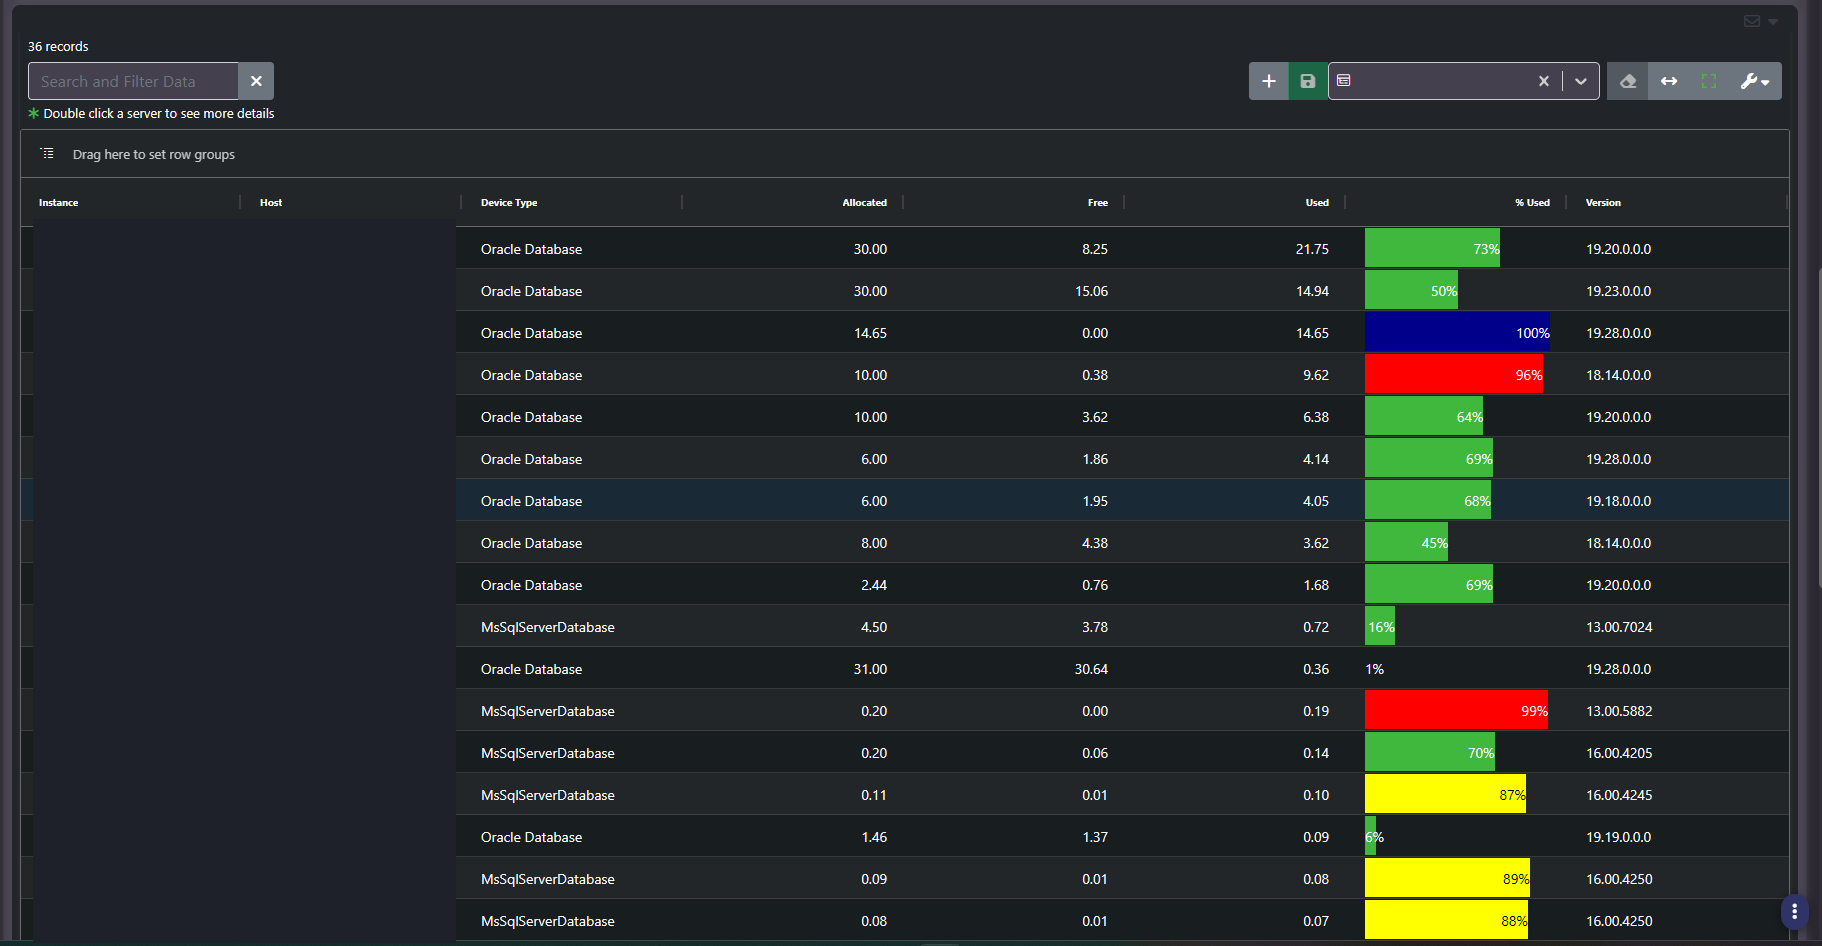
Columns are Instance, Host, Device Type, Allocated, Free, Used, % Used, and Version. Percentage cells render as proportional data bars with severity colouring, and a distinct colour marks instances at full allocation. Helper text notes that double-clicking a server opens more detail.
Version sitting in the same row as capacity is useful: it lets one pass identify instances that are both large and behind on patching, which are the hardest to schedule maintenance for and therefore the ones to plan earliest.
Common actions
- Sort by % Used descending. The data bars make the top of the list readable without reading numbers.
- Check small allocations before reacting to a high percentage. An instance at 99% of a fraction of a gigabyte is not the same risk as one at 96% of thirty.
- Group by Device Type to compare platforms on their own terms.
- Sort by Version to see patch spread, then move to the Versions sunburst for the full picture.
Tips
An instance at 100% allocated is not necessarily failing. Some databases are configured to fill their allocation and extend on demand. Check the free column and the growth chart before treating it as an incident.
Related screens
Database All Instances carries the fuller per-instance detail including edition and object counts. Databases Versions shows patch fragmentation properly. Health Alerts covers what is alerting now.