

Backup Pool Trend
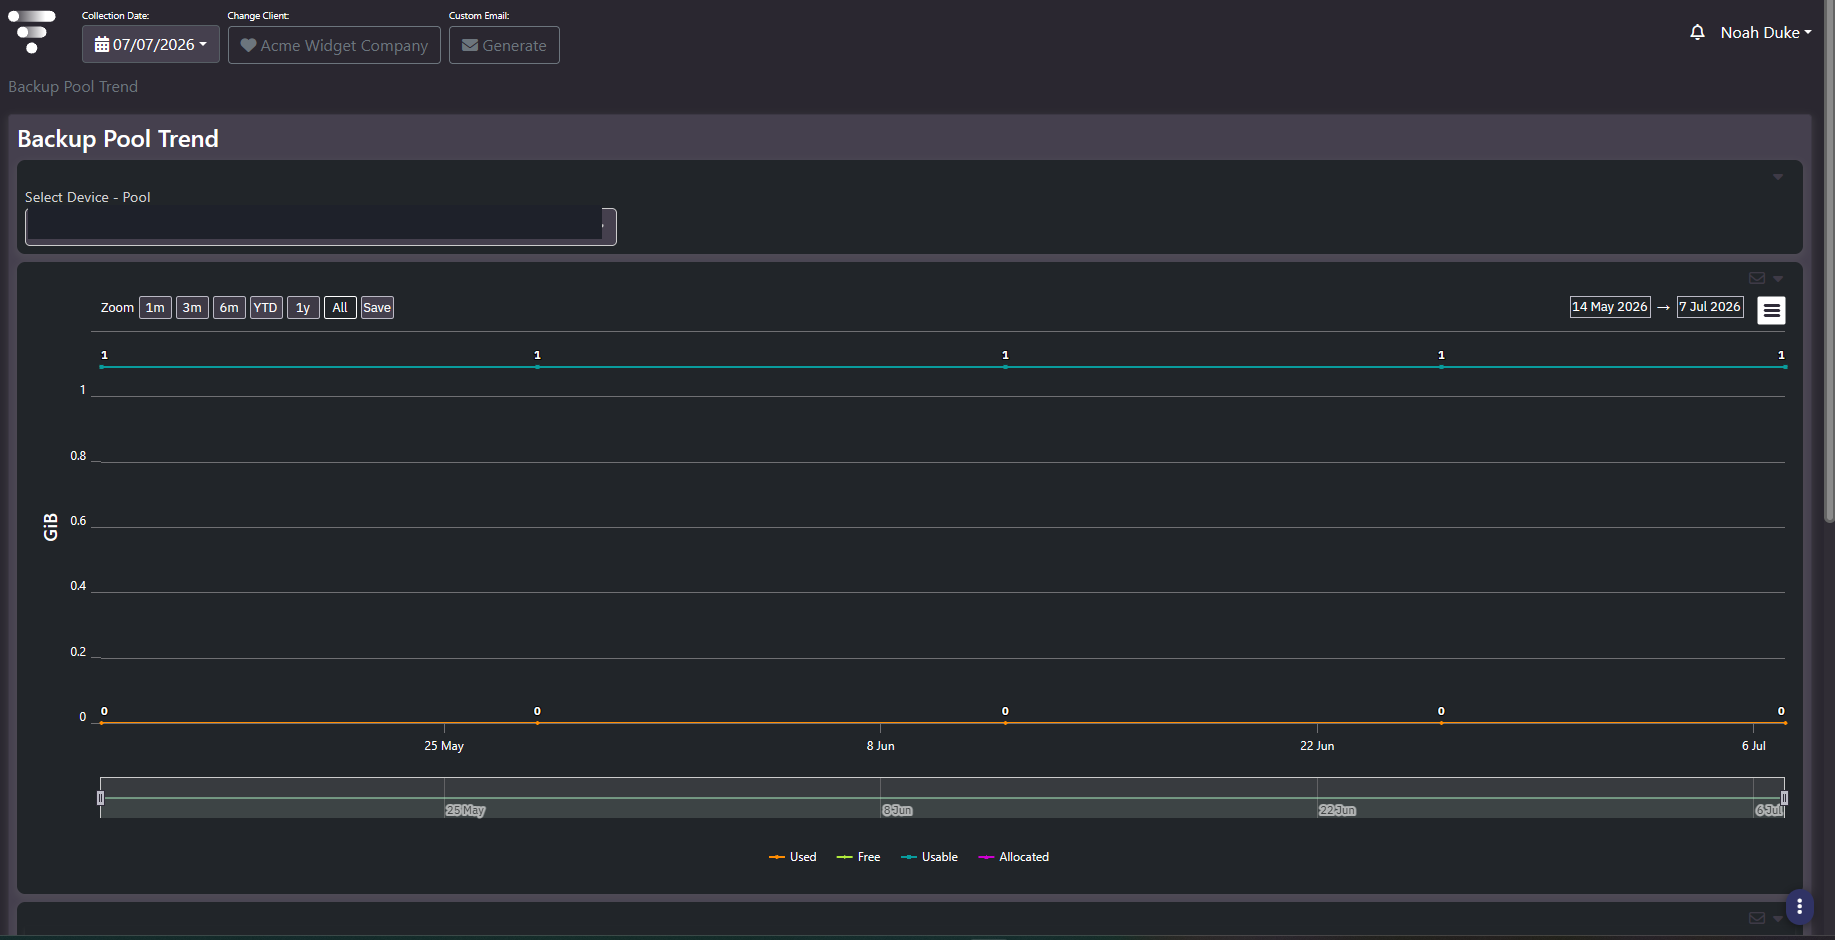
Purpose: One backup pool’s capacity over time. Four series, used, free, usable, and allocated, for a single selected device and pool. It is the drill-down from Pool Summary and the screen that turns a percentage into a date.
When to use it
- Work out when a specific pool will run out of room
- Confirm a retention change had the intended effect on one pool
- Check whether a pool was expanded and by how much
- Distinguish steady growth from a one-off ingest event
Key areas and metrics
- Select Device – Pool. A single dropdown combining the backup device and the pool on it. Everything on the screen is scoped by this selection, and the pool is identified by device so pools of the same name on different appliances stay distinct.
- Four series. Used, Free, Usable, and Allocated, in GiB. Allocated appears here and not on the estate-wide trend, which is what makes this the screen for over-allocation questions.
- Chart furniture. Zoom presets, a save control, explicit date pickers, an export menu, a per-panel email action, and a range brush.
Allocated against usable
The pairing to watch is allocated against usable. Allocated above usable means the pool has been promised more capacity than physically exists, which works while consumption stays low and stops working when it does not. Reading those two series together over a year shows whether the gap is widening.
Used against free then gives the runway. Extend the used line at its observed slope until it meets the free line, and that intersection is the date to plan against. That is a more defensible input to a purchase request than a current percentage.
Common actions
- Arrive from Pool Summary. Identify the pool there, then come here for its history rather than browsing the dropdown.
- Use All first. Pool capacity changes in steps, and a short window can miss the expansion that explains the current position.
- Save the view for pools under active watch so the same window is used each review.
- Note that a flat line at zero is a real answer. Some pools are configured and never used, which is worth knowing.
Tips
Check the y-axis scale before reading the shape. A pool holding a few gibibytes and one holding hundreds of terabytes produce identically shaped charts, and the axis is the only thing distinguishing a lab pool from a production one.
Related screens
Backup Pool Summary is where a pool gets identified. Backup Summary Trend is the estate-wide equivalent. Backup Host Occupancy shows which clients are filling the pool.