

Enterprise Summary
The starting point: utilization, alerts, efficiency, and performance for every array on one screen.
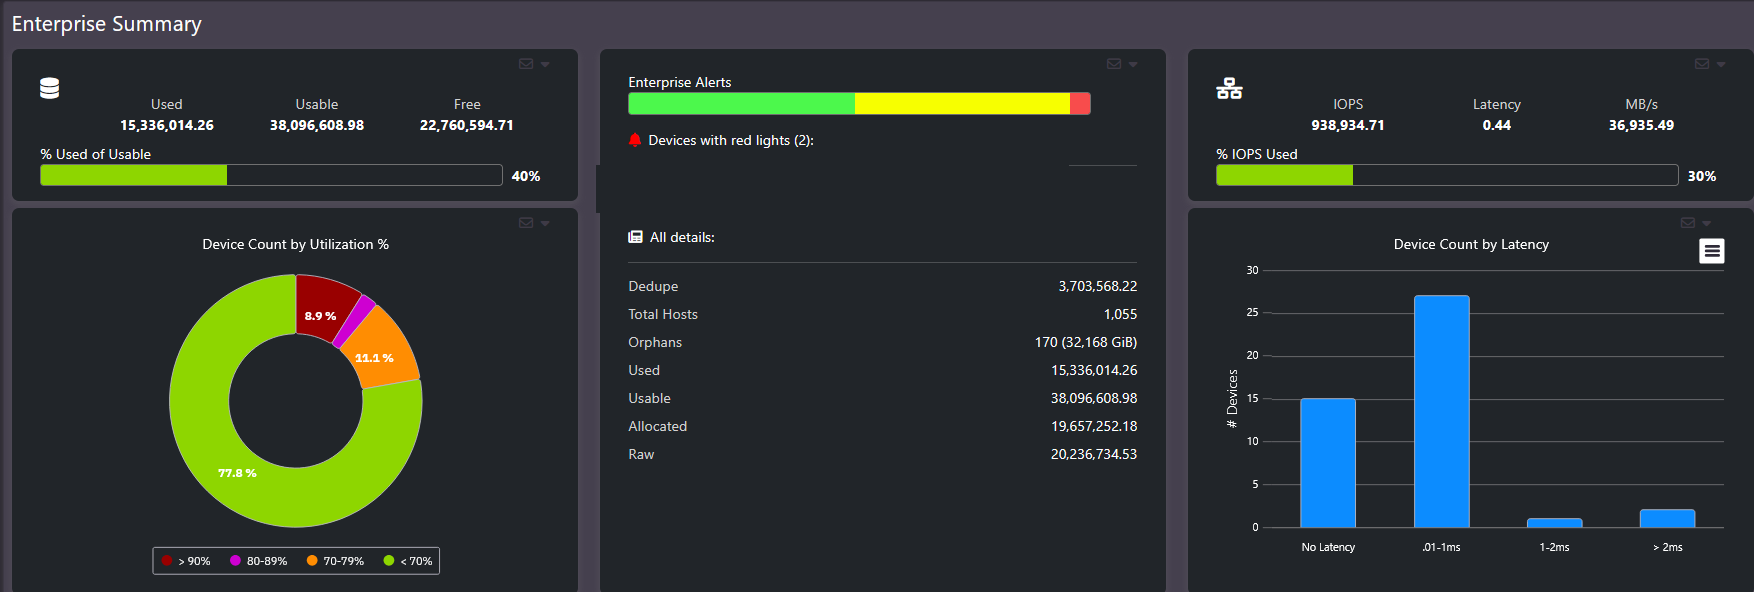
Enterprise Summary answers the first question about any storage estate: where should I be looking? The top of the screen shows how your devices distribute across utilization ranges, where alerts are firing, and how many devices sit in each latency band. If a device is in the red utilization range or the slow latency band, it stands out immediately.
What this screen shows
- Summary cards: total used, usable, and free capacity, percent of usable consumed, enterprise alerts, total IOPS, latency, and throughput.
- Device Count by Utilization: how many devices sit in each utilization band, so the ones running hot are visible at a glance.
- Device Count by Latency: the same banding for response time.
- The grid: every device group with capacity, efficiency, pool, host, and performance columns.

The four columns worth checking every week
| Column | What it tells you | What to act on |
|---|---|---|
| Data reduction (DRR) | Real efficiency delivered per device: compression, deduplication, and reduction combined | Large ratio gaps between platforms doing similar work |
| Orphan space | Capacity that looks used but has no host attached | Reclaim candidates; confirm they are not replication or DR targets first |
| Pools | Fragmentation indicator; allocations cannot span pools | High pool counts with free space that may be unusable in practice |
| IOPS / Latency | Where the work goes and whether the arrays keep up | Devices carrying heavy workload with poor response time |
Data reduction. Differences between devices are buying signals: if one platform delivers 4:1 and another delivers 1.3:1, the same purchased terabyte goes four times as far on the first. Some vendor reports inflate this ratio by counting thin provisioning; Visual One counts only the efficiency mechanisms that reduce real consumption.

Orphan space. At typical storage costs it adds up fast: 100 TiB of orphan space at $750 per TiB is $75,000 of avoidable spend. Orphan space is usually reclaimable, with one caveat: replication targets and DR sites legitimately hold storage with no local host, so confirm before reclaiming.
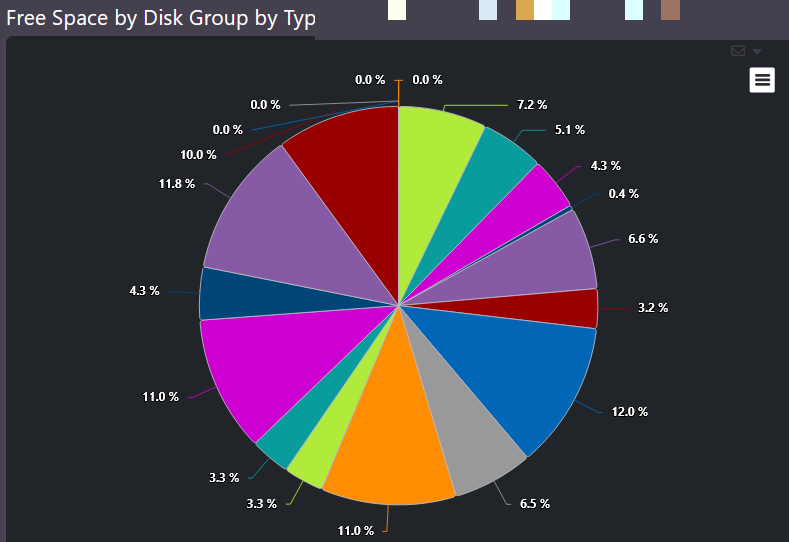
Pools. A device with 18 pools can show plenty of free space in total while being unable to satisfy a single large allocation. If you keep every pool at 80% utilization, 18 pools means roughly 300% more stranded free space than the same capacity organized into 4 pools. Fewer, larger pools also reduce management overhead on the array itself.
Performance. A device carrying heavy IOPS with the best response time is healthy. A device doing a lot of work with poor response time is the problem to chase.
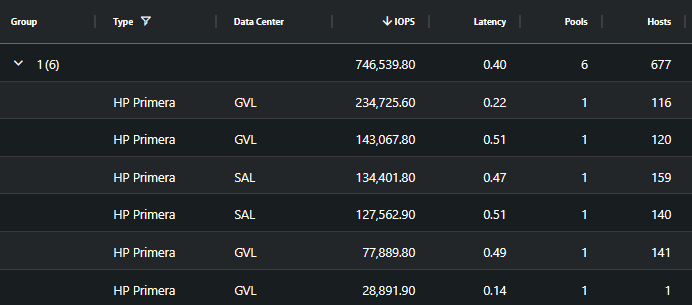
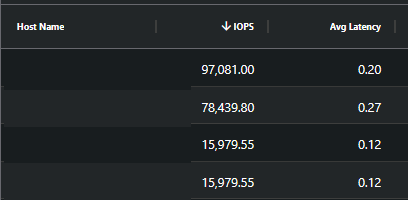
Tip: Sort the grid by any of these four columns. The outliers at the top of each sort are the week’s questions worth asking.
Real-world use case
A prospective customer received a single note after an initial data collection: the environment held roughly 250 terabytes of orphan space, concentrated on one array and clearly tied to one database platform by the volume naming. The customer investigated, confirmed a cancelled project had left the capacity provisioned but unused, and cancelled a half million dollar array purchase that was already in motion. Reclaimed orphan space is the fastest cost avoidance in storage.
Related screens
Drill from anything here into All Units for per-resource detail, Trends for how these numbers move over time, and Enterprise Capacity Plan for when they become purchase decisions.