

Host and Device Capacity Modeling
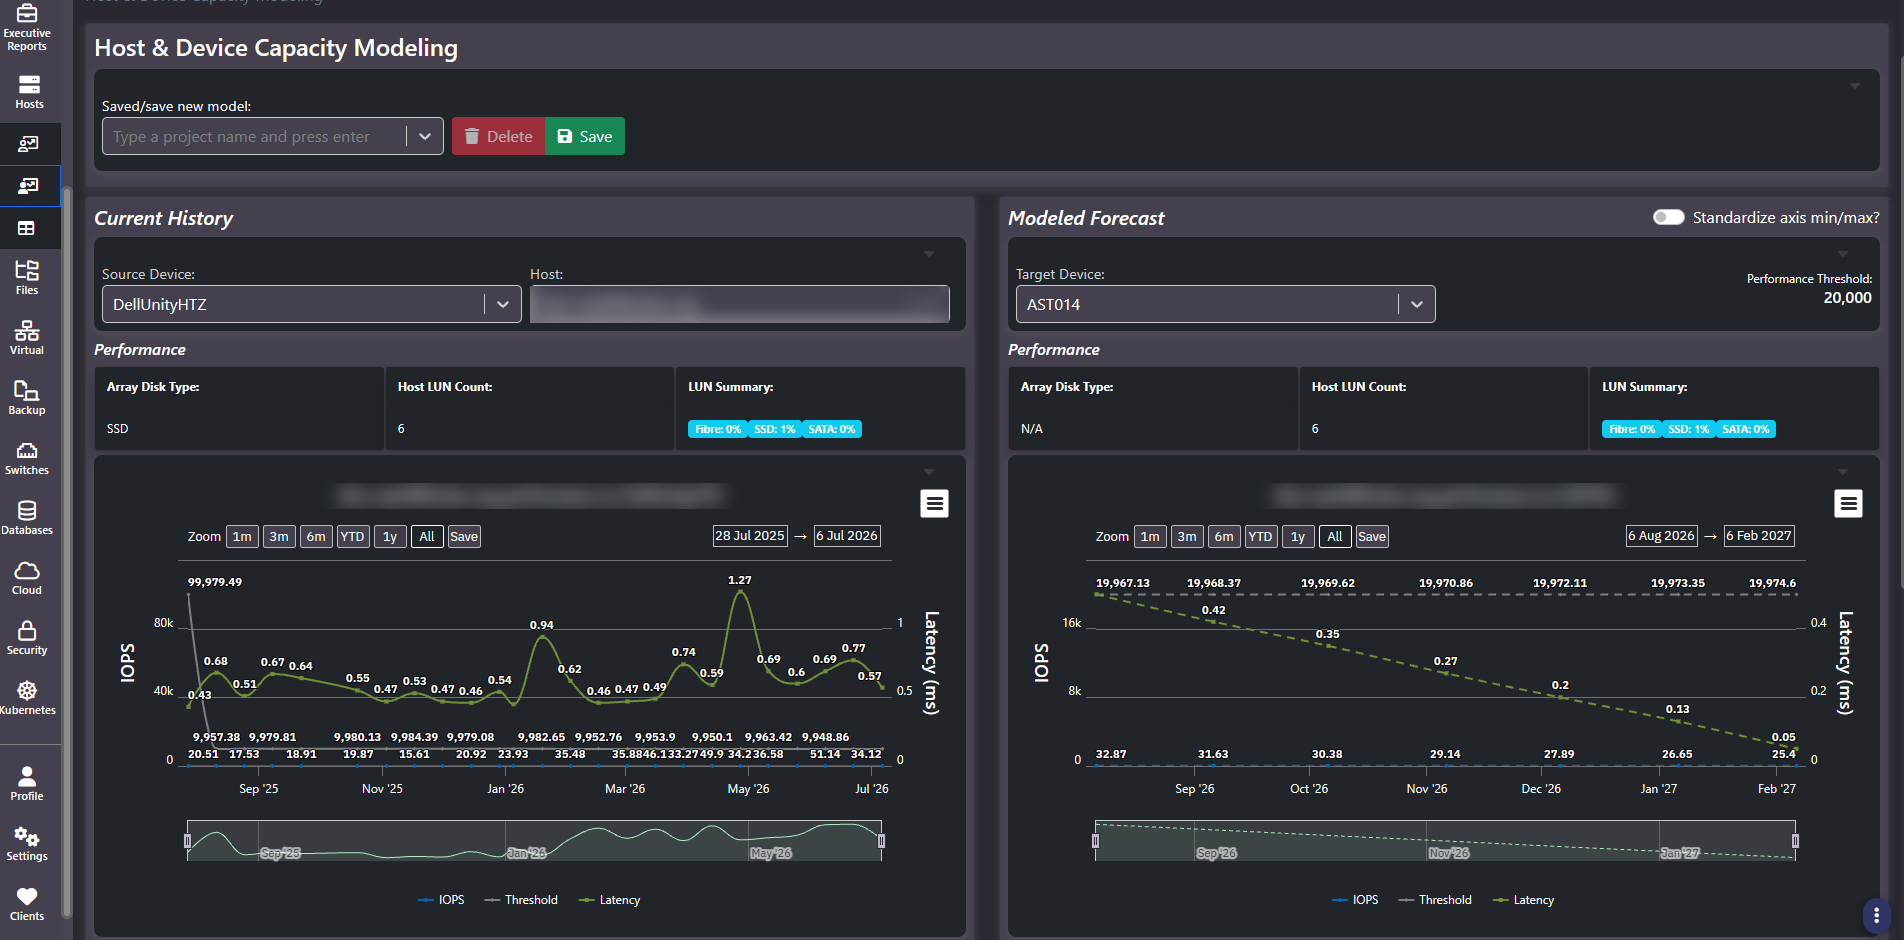
Purpose: Model moving a host’s storage from one array to another and see the projected result before committing. Current history on the left, modeled forecast on the right, for both performance and capacity. It is the storage migration decision screen.
When to use it
- Test whether a target array can absorb a host’s workload before migrating it
- Check whether a move would resolve a latency problem or just relocate it
- Confirm the target has capacity headroom once the host’s data lands, including its deduplication effect
- Build a defensible case for a migration or an array purchase
Key areas and metrics
| Control | What it sets |
|---|---|
| Saved / save new model | A named, reusable scenario, with delete and save controls |
| Source Device and Host | The current placement, driving the left-hand panels |
| Target Device | The proposed destination, driving the right-hand panels |
| Performance Threshold | The IOPS ceiling the forecast is judged against |
| Standardize axis min/max | Forces both charts onto the same scale so they are visually comparable |
Each side carries a performance strip showing Array Disk Type, Host LUN Count, and a LUN Summary breaking media across fibre, SSD, and SATA, plus a capacity strip showing Array Utilization, Deduplication ratio, and Host Utilization.
Turn on axis standardization first
The two charts auto-scale independently by default, which makes them look similar when the underlying values differ by orders of magnitude. A current-state IOPS axis reaching tens of thousands next to a forecast axis reaching a few dozen produces two charts of comparable visual size describing wildly different workloads.
The Standardize axis min/max toggle exists for exactly this. Turn it on before drawing any conclusion, and certainly before screenshotting the comparison for anyone else.
The capacity view
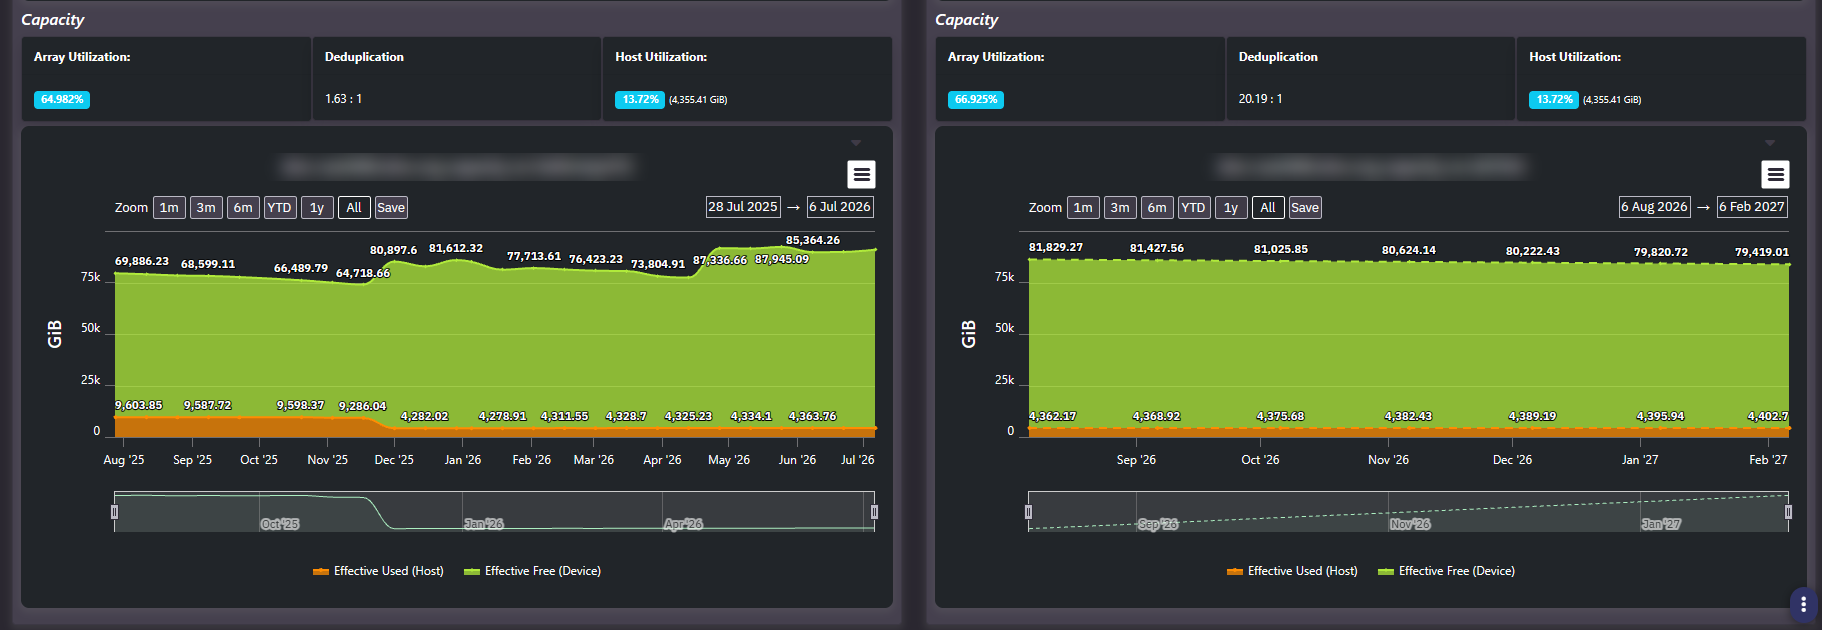
Beneath the performance charts, a second pair plots Effective Used (Host) against Effective Free (Device) in GiB, historical on the left and projected on the right.
The deduplication ratio in the capacity strip is the figure that most often changes a migration answer. A host consuming a given amount on an array achieving a low reduction ratio can consume dramatically less on a target achieving a high one, so a move that looks impossible on raw capacity may be comfortable in practice. Read both ratios before sizing the target.
Common actions
- Enable axis standardization before reading either chart.
- Set the performance threshold to the target array’s real ceiling, not a default, or the forecast is judged against the wrong bar.
- Compare the two disk-type and LUN-summary strips. Moving a workload from SSD to a slower media mix will not deliver the latency the forecast implies.
- Save the model with a name that identifies the decision, so the scenario can be reproduced when someone questions it later.
Tips
An Array Disk Type reading as unavailable on the target side means the platform has not characterized that array’s media. The capacity forecast still holds, but treat the performance projection with more caution, since media type is the largest single factor in it.
Related screens
Enterprise Host Summary identifies which hosts are worth modeling. Enterprise Capacity Plan covers whether the target array has runway independent of this host. Cluster Modeling is the compute-side equivalent.