

Storage Overview
What the Storage section covers and how its reports fit together.
The Storage section gives you every storage array in your environment in one place: capacity, efficiency, performance, health, and growth, normalized across vendors. Instead of logging into each device’s own management console, you open one set of reports that work the same way whether the underlying hardware is IBM, NetApp, HP, Dell EMC, Pure, or anything else Visual One collects from.
Where Storage fits in Visual One
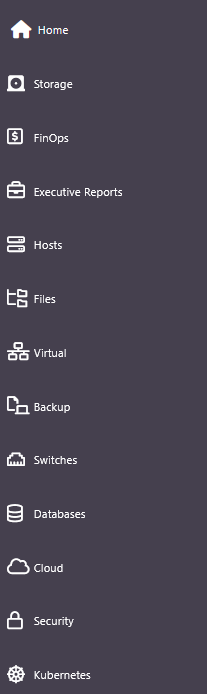
Storage is one of several contexts in the main navigation, alongside FinOps, Hosts, Files, Virtual, Backup, Switches, Databases, Cloud, Security, and Kubernetes. Data integrates across those boundaries. A finding that starts in a storage report, such as a volume with unexpected growth, can be followed to the hosts and virtual machines driving it.
The reports in this section
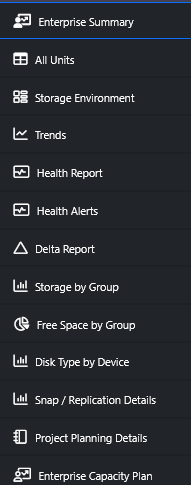
The Storage context contains thirteen reports. Each has its own page in this documentation.
| Report | What it answers |
|---|---|
| Enterprise Summary | Where should I be looking? Utilization, alerts, efficiency, and performance for the whole estate on one screen |
| All Units | Every stat plus growth for any resource type, devices through nodes, in one sortable table |
| Storage Environment | The big-picture heat map by data center, sized by capacity and colored by health |
| Trends | How capacity and performance move over time, at any grouping level |
| Health Report | Whether anything is wrong, across six health categories for every device |
| Health Alerts | Every individual alert, with severity, acknowledgment, and ServiceNow escalation |
| Delta Report | Exactly what changed between any two dates |
| Storage by Group | Where capacity sits, by data center, device type, classification, application, or tier |
| Free Space by Group | Where free space actually exists, and whether it is where you need it |
| Disk Type by Device | The media mix behind each array: flash, SSD, SAS, SATA, fibre |
| Snap / Replication Details | Every snapshot and replication relationship, summarized and in detail |
| Project Planning Details | Documentation in progress |
| Enterprise Capacity Plan | When you run out of space, forecast at group, device, and pool level |
How to use these reports
Every report with a pulldown has choices. Groupings such as data center, device type, classification, application, and tier are configurable, so the views reflect how your organization actually thinks about its storage. Weekly summary emails track the same numbers over time, and the reports are where you go to answer the questions those emails raise.