

Tag Forecasting
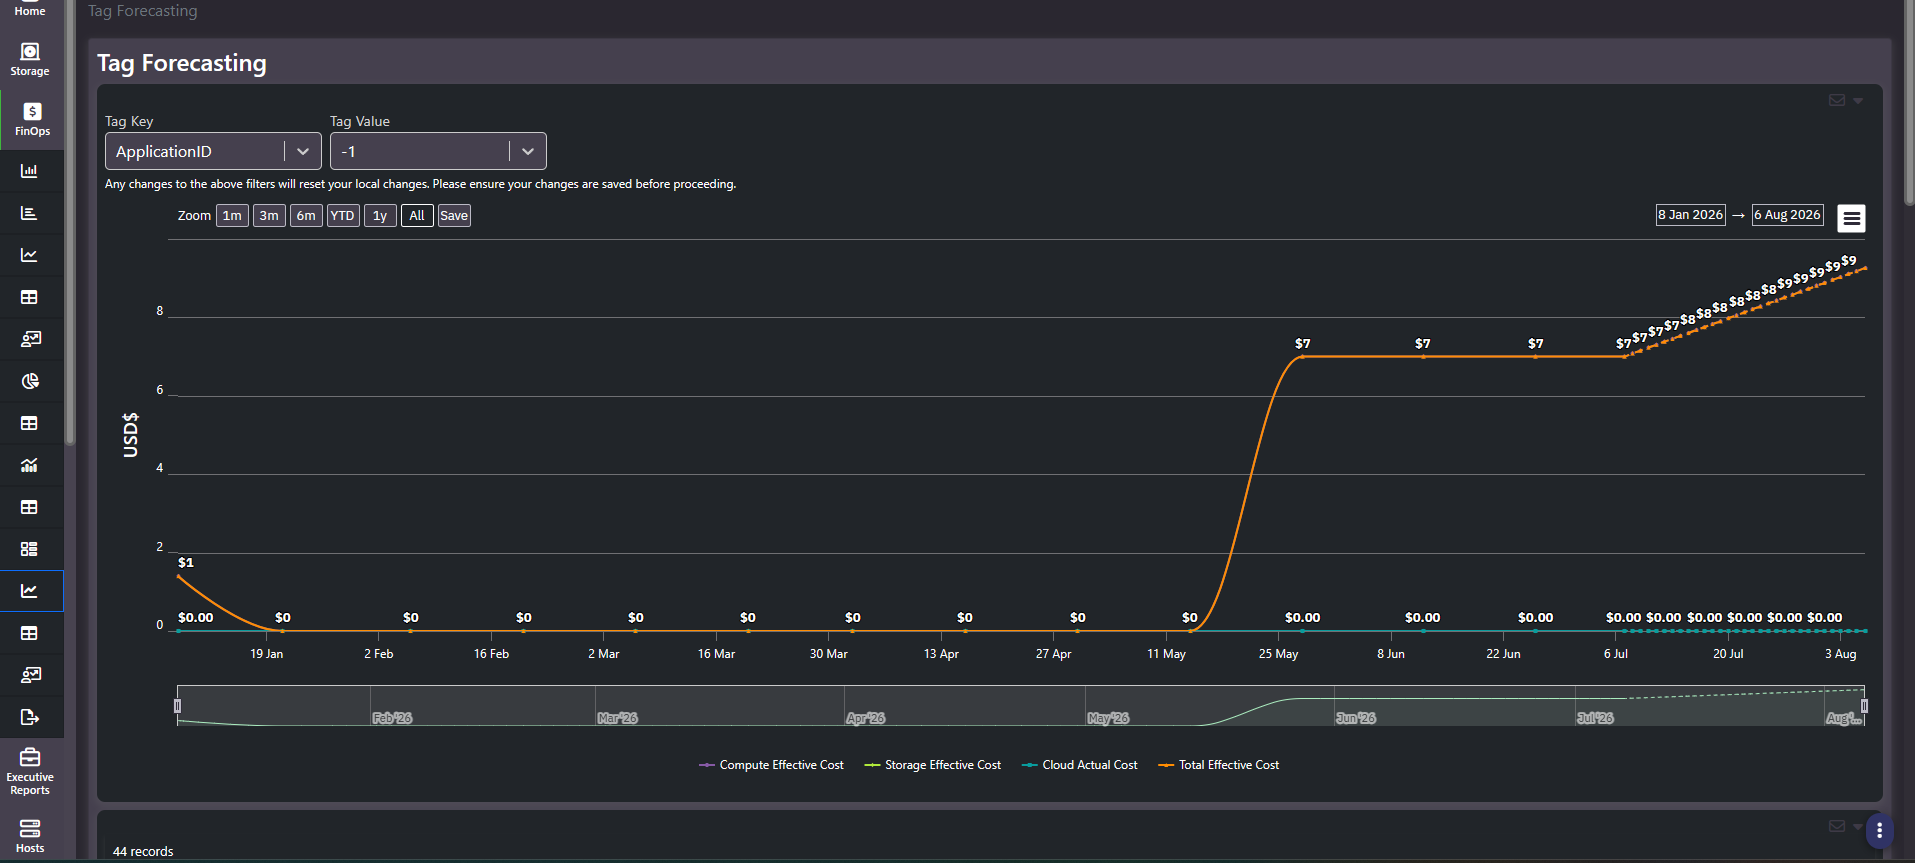
Tag Forecasting projects where a tag’s cost is heading. It takes the historical daily spend for one tag key and value, splits it into compute, storage, and cloud, and continues each line past today so a business unit can be told what it is on track to spend rather than only what it has spent.
The report appears in the navigation as Tag Forecasting. The page header and route refer to tag capacity planning, and it is the destination of the To Capacity Planning button on Tag Summary. They are the same screen.
What this screen shows
A multi-line chart carrying four series, plus a daily grid holding the same values in tabular form.
| Series | What it covers |
|---|---|
| Compute Effective Cost | Virtual machines and hosts carrying the tag |
| Storage Effective Cost | Arrays, volumes, and shares carrying the tag |
| Cloud Actual Cost | Cloud resources carrying the tag |
| Total Effective Cost | The three above combined |
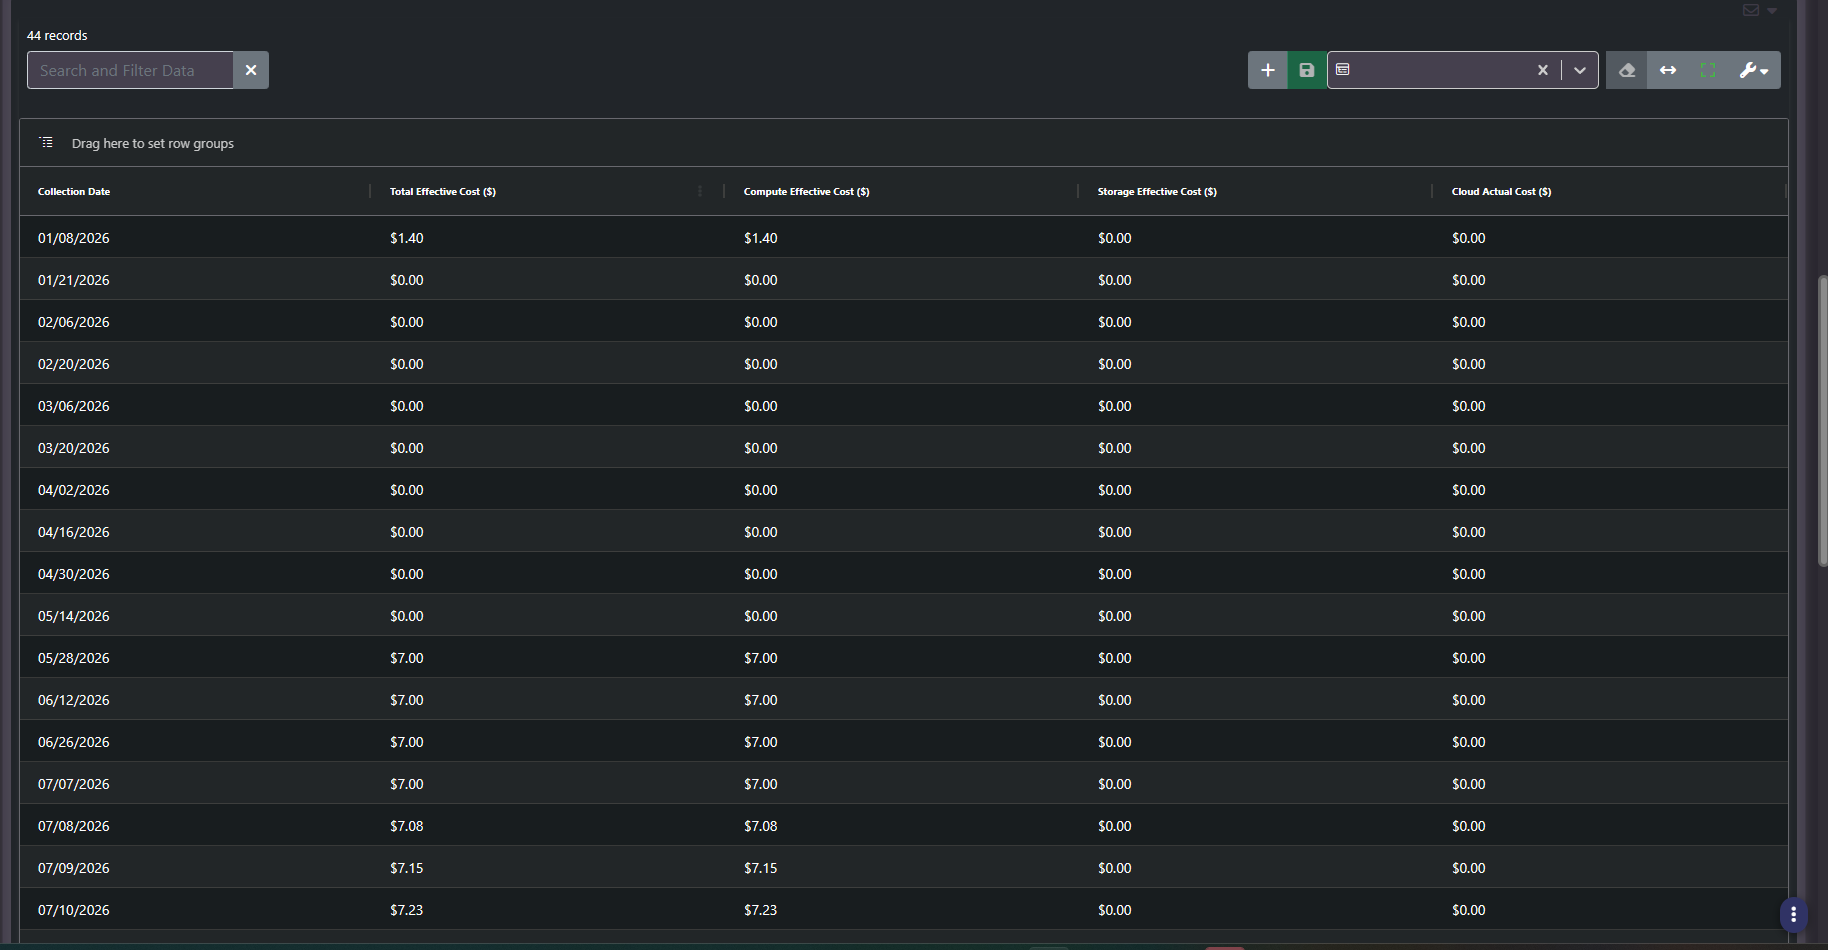
The x-axis extends beyond the current Collection Date. Segments past that point are rendered lighter or dashed to distinguish projection from actuals. The grid does the same thing in rows: Collection Date, Total Effective Cost, Compute Effective Cost, Storage Effective Cost, and Cloud Actual Cost, with historical and future-dated rows sitting in the same table.
Reading the forecast
- It is a trend continuation, not a plan. The projection extends the observed pattern. It does not know about a migration you have scheduled or a project that ends next month.
- Check the split, not just the total. A flat total can hide storage climbing while cloud falls. The four series exist so that offset is visible.
- Short horizons are the reliable ones. The projection is most useful for the next few weeks of run rate. For a multi-year capital question, use the capacity planning and amortization screens instead.
Note: Changing the Tag Key or Tag Value resets unsaved local changes to the view. Save the view first if you have configured columns, groupings, or a date window you want to keep.
Why actuals and projections share one table
Everything to the left of the last collection date is actual. Everything to the right is projected from historical spend patterns. The projected segment is rendered as a dashed continuation specifically so that nobody confuses the two in a budget meeting, which is the failure mode this design is guarding against.
In the grid, actual and projected rows sit in the same table and the same columns rather than being separated. That is deliberate: finance exports one dataset instead of reconciling two, and the collection date on each row is what tells you which side of today it came from.
Related screens
Tag Summary is where this screen is usually entered from, and it shows the resources behind the numbers. Tag Cost Modeling handles the opposite case: cost for a workload that does not exist yet and therefore has no history to extend. Cost YTD forecasts at the whole-estate level.