

Optimization Recommendations
Where the Savings Report says how much, Optimization Recommendations says what to do. Each row is a specific recommended action with an estimated saving attached, a count of how many resources it applies to, and where it sits in the adoption cycle.
What this screen shows
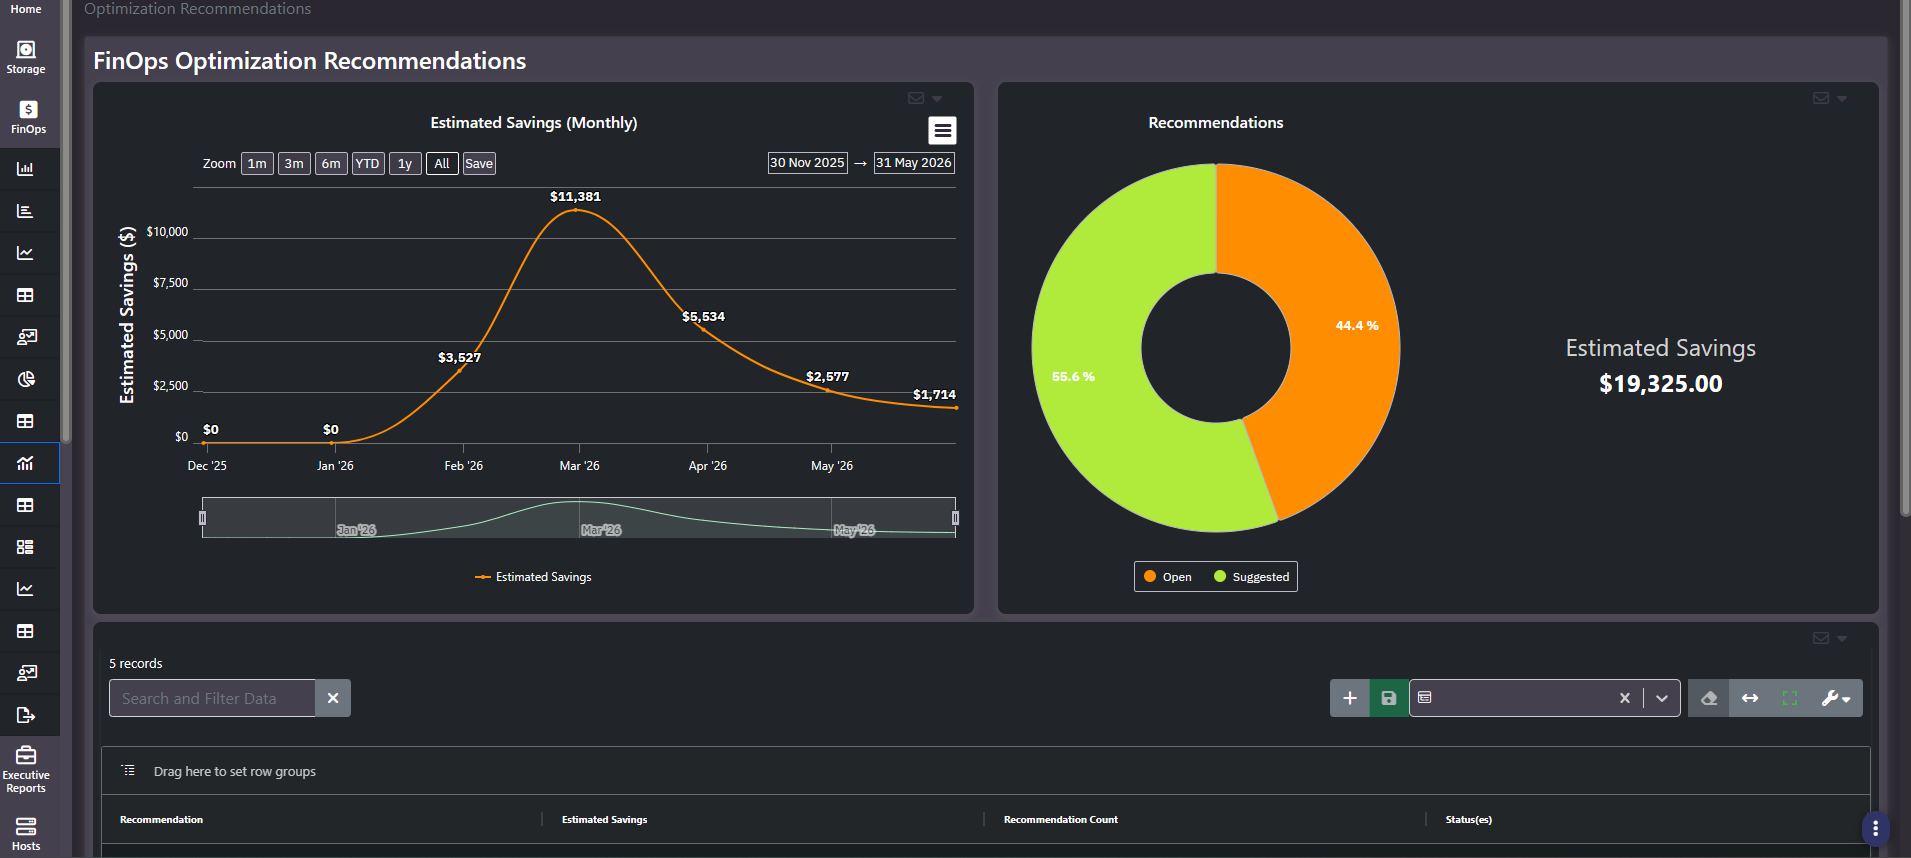
- Estimated Savings (Monthly). A line chart of the opportunity over time, with the standard zoom presets, date pickers, and range brush. A declining line is usually good news: it means recommendations are being acted on faster than new ones appear.
- Recommendations donut. The current set broken down by status, with the total estimated saving as the centre readout.
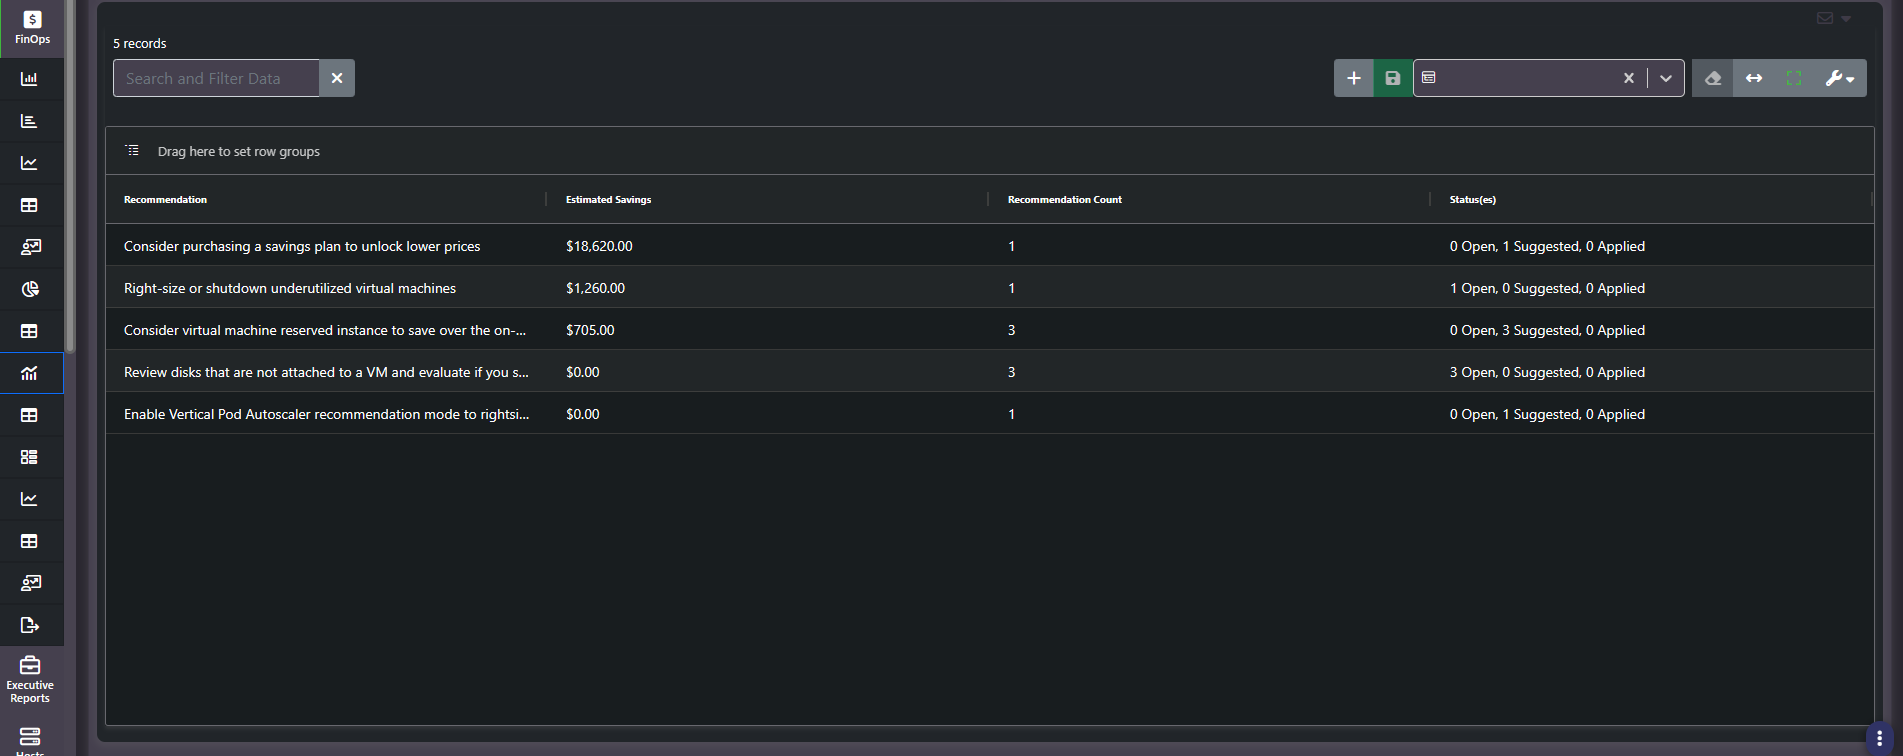
- Detail grid. Columns are Recommendation, Estimated Savings, Recommendation Count, and Statuses.
The status lifecycle
The Statuses column breaks each recommendation type into three states rather than showing a single label, because one recommendation type usually covers several resources at different stages.
| State | What it means |
|---|---|
Suggested | Surfaced by the analysis, not yet reviewed by anyone |
Open | Accepted and in flight |
Applied | Implemented, and the saving should now show up in actual cost |
How a recommendation gets executed depends on its type. A commitment purchase happens with the provider. Virtual machine right-sizing can be applied by Visual One: approved recommendations are queued and right-sized on the next upload. Because that path writes to the environment rather than reading from it, it is a separate configuration outside the read-only collector and requires its own account approval, so it is off unless you have deliberately enabled it. The value of the status column is that it gives the FinOps conversation a backlog instead of a list of good intentions that resets every month.
What kinds of recommendation appear
- Commitment purchases. Savings plans and reserved instances where consistent, long-running usage is being paid for at on-demand rates.
- Right-sizing. Resources allocated more CPU, memory, or capacity than they use.
- Kubernetes tuning. Recommendations such as enabling vertical pod autoscaler recommendation mode to right-size container requests and limits.
- Cleanup. Orphaned and unattached resources that are still being billed.
The mix spans cloud, virtual, and container estates in one list, which is the point: an infrastructure team that reviews cloud recommendations in one console and VM right-sizing in another rarely prioritizes across the two.
Tip: Sort by Estimated Savings and read the top three, then check the Recommendation Count. A large saving spread across many resources is a project. The same saving concentrated in one or two resources is this afternoon’s work.
Identified savings versus realized savings
Every recommendation carries a status, a type, and a recency, which is what makes this a working queue an engineering team can own rather than a static list that resets each month. The status progression from suggested through open to applied is also the audit trail.
That trail is what lets two later questions be answered from the same screen. When procurement asks whether last year’s commitment actually paid off, and finance asks where the savings landed, realized savings can be checked against identified savings. The savings are tracked rather than only reported.
Examples of what appears
The list spans providers and estates in one place: a cloud recommendation to reduce a virtual machine from six gigabytes of memory to one, a core count reduction for workload optimization, a compute savings plan or reserved instance purchase where consistent usage is being paid at on-demand rates, and container tuning such as enabling vertical pod autoscaler recommendation mode. Each carries the environment it applies to, so you can see which environments have outstanding right-sizing opportunities and which are clean.
Related screens
Savings Report quantifies the same opportunity by context rather than by action. Cost Efficiency Dashboard identifies which assets are worth optimizing in the first place. Cost YTD is where an applied recommendation eventually shows up as a lower run rate.