

Cloud Resource Group Forecast
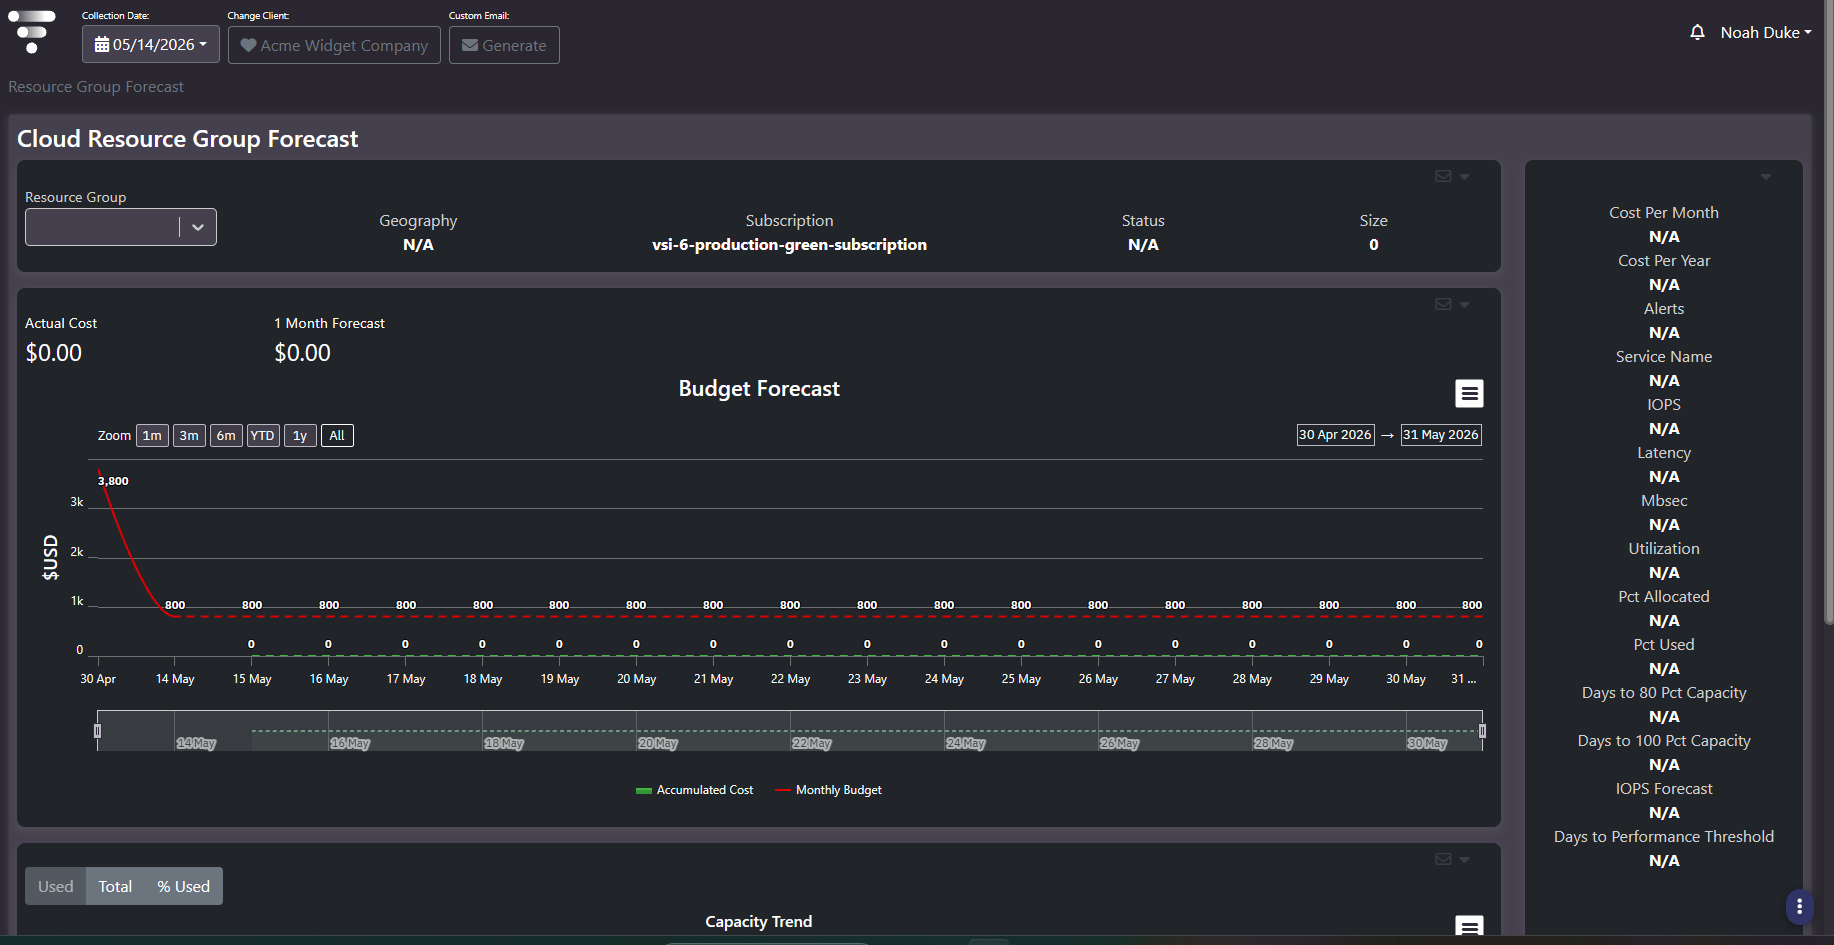
Purpose: One resource group in depth. Accumulated cost against budget, a capacity trend across memory, disk, and CPU, and a metrics rail carrying cost, performance, and runway figures. It is the drill-down destination for anything the portfolio screens flag.
When to use it
- Check whether one resource group will breach its monthly budget
- See where its capacity and performance are heading, not just its cost
- Establish how many days remain before a capacity or performance threshold
- Support a conversation with the team that owns a specific resource group
Key areas and metrics
- Resource Group selector at the top left. Everything on the screen is scoped by it.
- Identity strip. Geography, Subscription, Status, and Size for the selected group.
- Actual Cost and 1 Month Forecast, stated side by side.
- Budget Forecast chart. Accumulated cost as one series against a monthly budget line, with zoom presets, date pickers, an export menu, and a range brush.
- Metrics rail down the right side.
- Capacity Trend beneath, with a
Used/Total/% Usedtab group.
The metrics rail
| Group | Fields |
|---|---|
| Cost | Cost Per Month, Cost Per Year |
| Operational | Alerts, Service Name |
| Performance | IOPS, Latency, Mbsec, IOPS Forecast, Days to Performance Threshold |
| Capacity | Utilization, Pct Allocated, Pct Used, Days to 80 Pct Capacity, Days to 100 Pct Capacity |
The three days to fields are what distinguish this from a cost screen. They convert a trend into a date, which is the form a capacity conversation actually needs. Days to 80 percent is the planning trigger; days to 100 percent is the deadline; days to performance threshold catches the case where a resource group runs out of speed before it runs out of space.
Capacity Trend
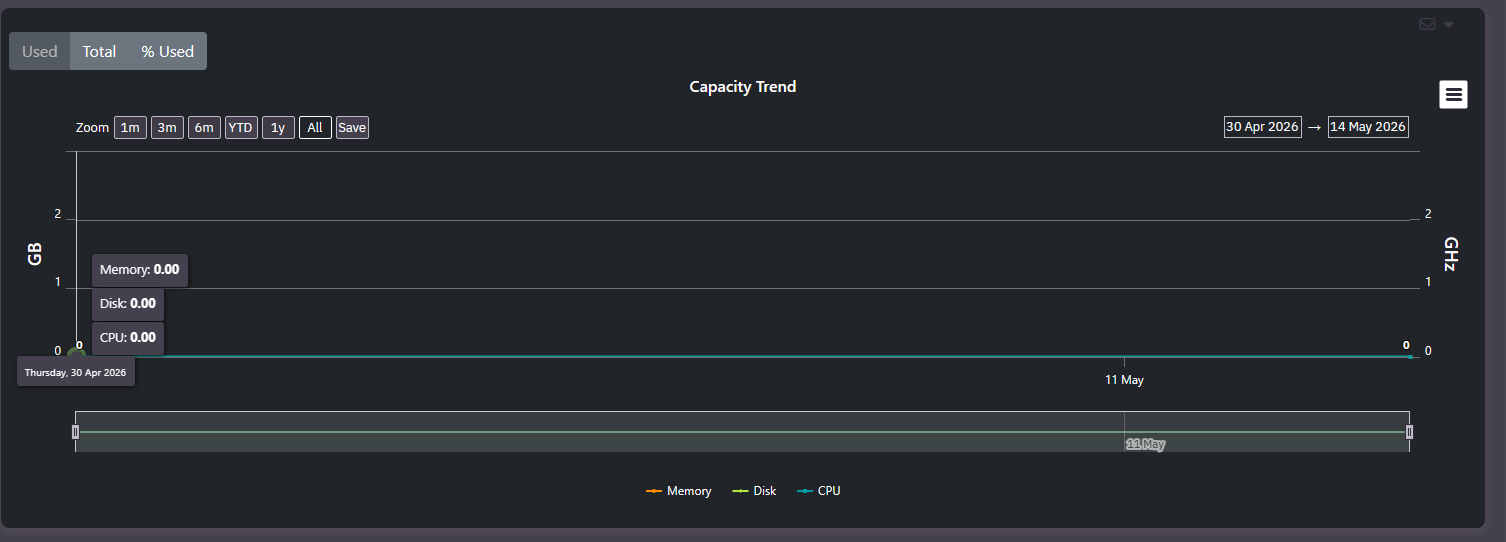
Three series, memory, disk, and CPU, on a dual axis: capacity in GB on the left and CPU in GHz on the right. Hovering shows all three values for a date at once. The tab group switches between absolute used, total provisioned, and percentage, so the same three series answer how much, how much is available, and how close to full.
Common actions
- Select a resource group first. With nothing selected the identity strip, metrics rail, and both charts read as unavailable or zero, which is an empty state rather than a finding.
- Read the two days to capacity figures together. A short gap between them means the group goes from comfortable to full quickly and there is little warning.
- Switch the tab group to % Used when comparing several resource groups, since absolute figures are not comparable across groups of different sizes.
- Check Days to Performance Threshold against the capacity dates. Whichever is shortest is the real constraint.
Tips
The metrics rail reads as unavailable across every field when no resource group is selected. That is the default state of the screen, not missing data.
Related screens
Cloud Resource Group Modeling is where a forecast becomes a scenario. Cloud Growth Overview identifies which resource group to open. Cloud Health Alerts carries the alerts the rail counts.