

Inventory Report
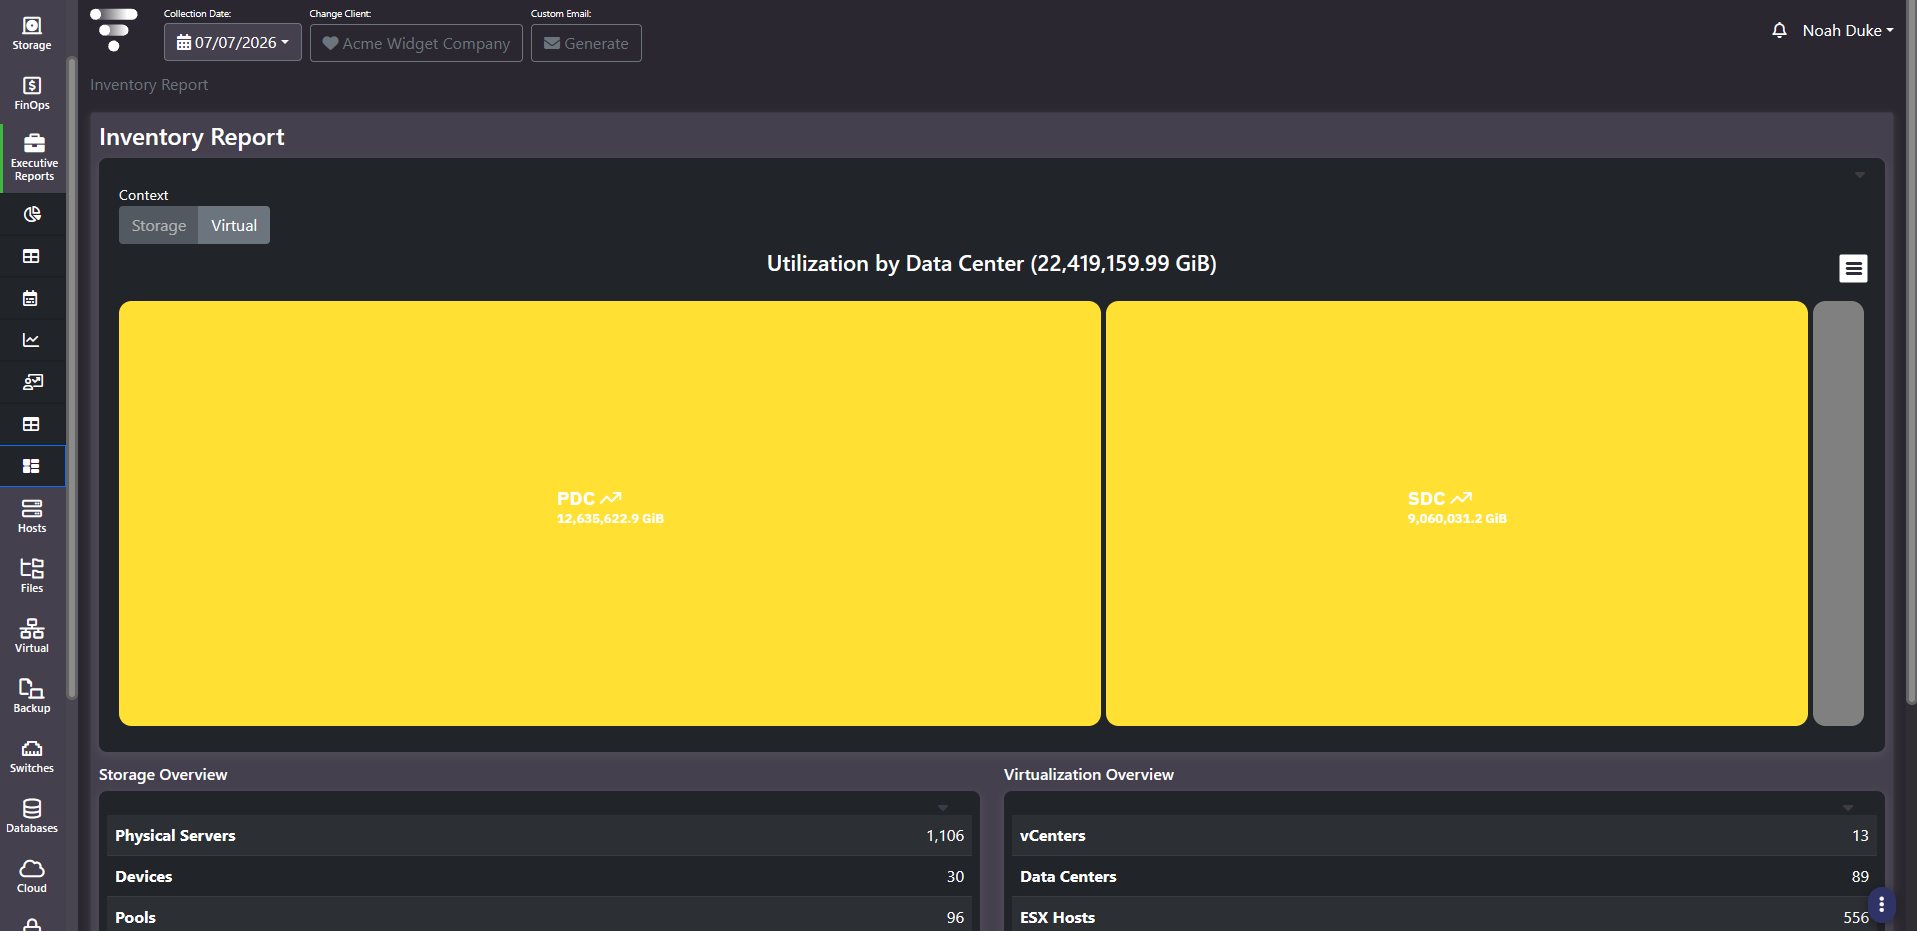
Purpose: How much of everything you have. A countable inventory of the storage and virtualization estate, over a treemap showing how capacity splits across physical sites. It is the reconciliation screen: the numbers here are what every other report is measuring against.
When to use it
- Answer how many arrays, hosts, VMs, or datastores are under management
- Reconcile the platform’s view against a CMDB or asset register
- Show site-level capacity distribution with total capacity stated explicitly
- Confirm collection coverage, since a context reporting zero usually means nothing is collected rather than nothing exists
Key areas and metrics
- Context toggle. A
Storage/Virtualswitch at the top that re-scopes the treemap above the overview panels. - Utilization by Data Center. A treemap with one tile per site, area proportional to capacity, each tile carrying its own capacity figure and a trend arrow. Total capacity appears in the panel title, so the tiles have a stated denominator.
- Overview panels. Two count lists, one for storage and one for virtualization.
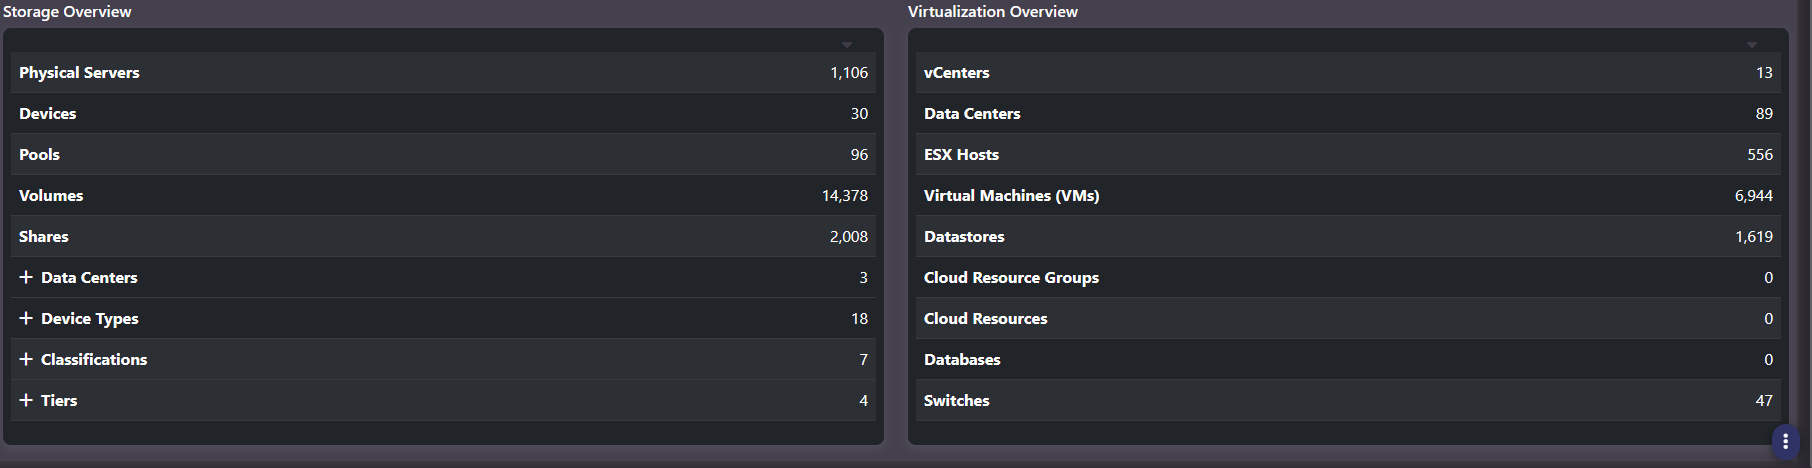
| Storage Overview counts | Virtualization Overview counts |
|---|---|
| Physical Servers, Devices, Pools, Volumes, Shares | vCenters, Data Centers, ESX Hosts, Virtual Machines, Datastores |
| Data Centers, Device Types, Classifications, Tiers, each expandable | Cloud Resource Groups, Cloud Resources, Databases, Switches |
The four expandable rows on the storage side are the useful part. Expanding Device Types breaks the device count down by vendor platform; expanding Classifications and Tiers does the same for data class and performance tier. That turns a single headline count into the composition behind it without leaving the screen.
Reading a zero
A count of zero means no objects of that type are being collected, which is not the same as none existing. Cloud, database, and switch counts frequently read zero in estates where those collectors have not been configured, while the infrastructure itself is very much in production.
This is worth checking before quoting any estate-wide total, and it is the single most common cause of a Visual One figure disagreeing with a CMDB.
Common actions
- Reconcile against the asset register. Device and host counts are the two that matter, and a mismatch is either a collection gap or an asset record nobody retired.
- Compare data center counts across the two panels. Storage data centers are physical sites; virtualization data centers are vCenter logical objects. They are named the same and count differently, so do not expect them to match.
- Expand Device Types before a vendor conversation. The breakdown is the leverage.
- Switch the context toggle to see the site treemap from the storage rather than the virtual side.
Tips
Virtualization data centers are logical vCenter containers, not buildings. A count in the dozens against a handful of physical sites is normal and does not mean the data is wrong.
Related screens
All Units is the full detail behind the storage counts, and Virtual covers the virtualization objects. Storage Environment presents the same site view as a health-coloured heat map. Tag Cost Inventory carries equivalent inventory panels alongside cost.