

Disk Used Trend
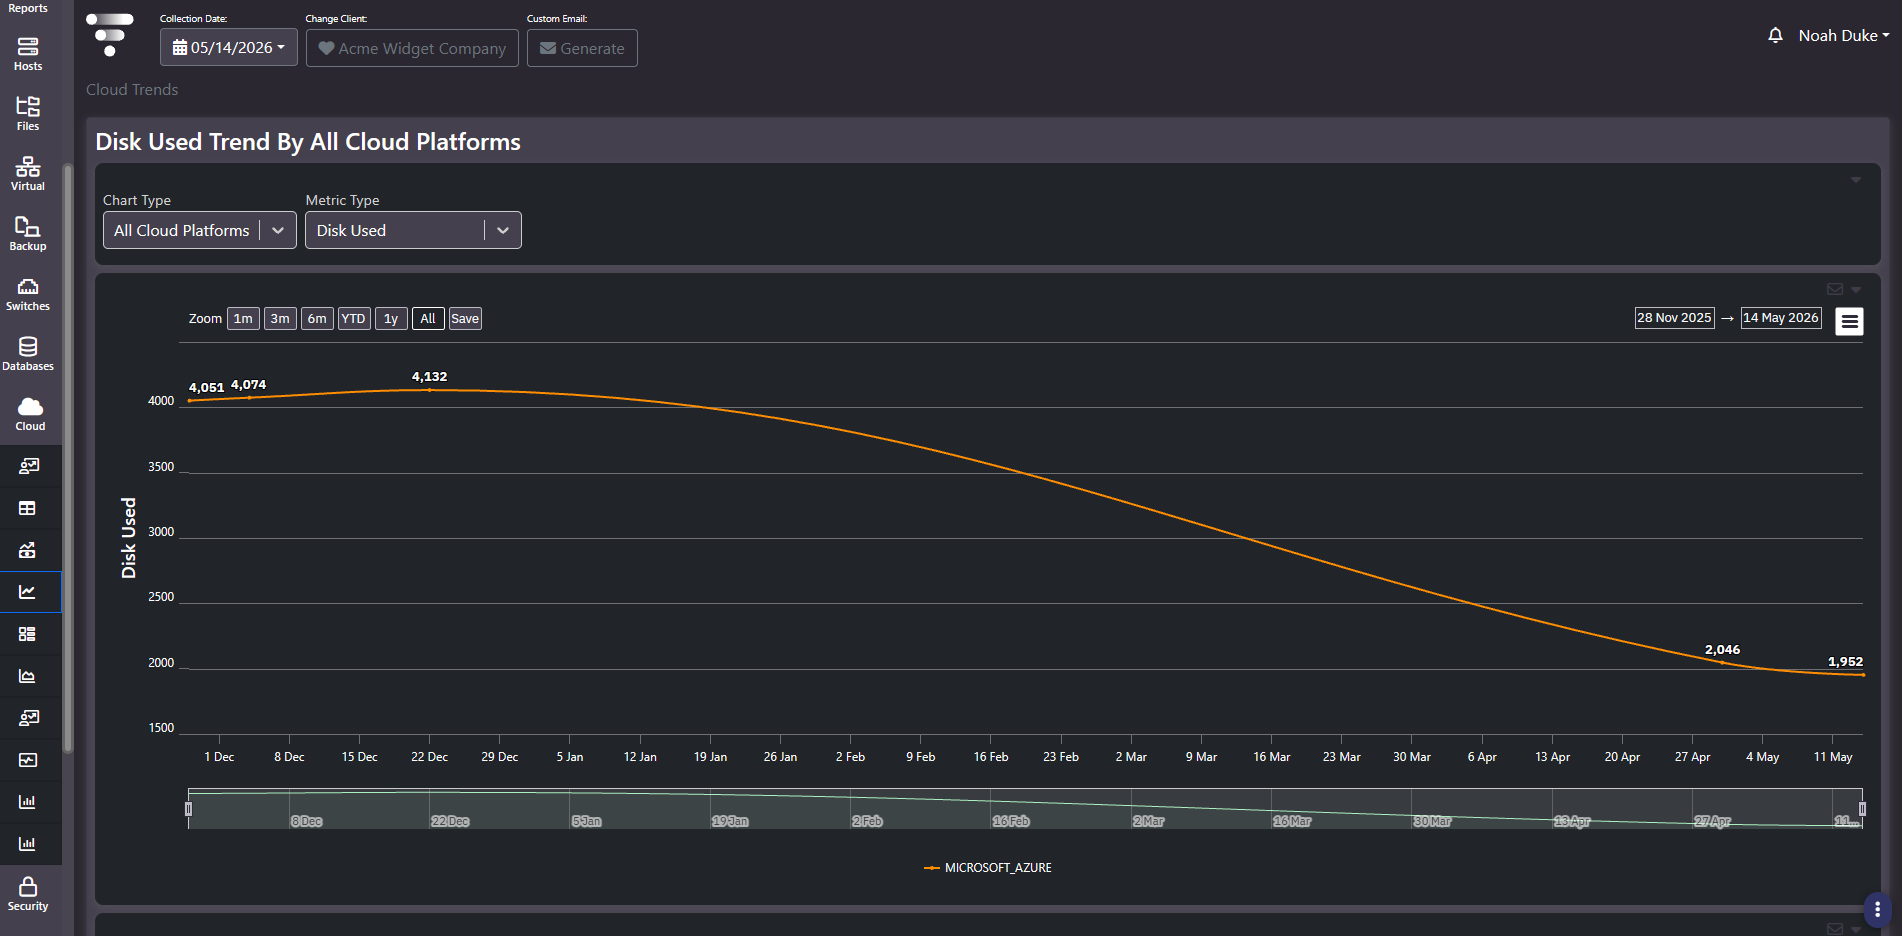
Purpose: Cloud storage consumption over time, across every collected cloud platform on one chart. A focused trend screen for the capacity dimension of cloud rather than the cost dimension.
When to use it
- Establish the cloud storage growth rate for forecasting
- Confirm whether a cleanup or migration actually reduced consumption
- Compare consumption across cloud platforms on a single axis
- Distinguish a genuine trend from a step change caused by onboarding
Key areas and metrics
- Chart Type. A dropdown scoping the chart, for example
All Cloud Platforms, which plots one series per collected platform. - Metric Type. A second dropdown choosing what is plotted, for example
Disk Used. The chart title and y-axis label follow the selection. - Chart. One line per platform with data labels on the points, zoom presets, explicit date pickers, a save control, an export menu, and a range brush beneath.
Because both selectors drive the same chart, the screen covers a matrix of questions rather than one. Change the metric to move from storage to another dimension; change the chart type to narrow from all platforms to one.
Reading a sustained decline
A long smooth downward curve is unusual in cloud storage and worth understanding rather than celebrating. Genuine reduction from a cleanup programme looks like a series of steps, because deletions happen in batches. A smooth continuous decline more often reflects retention policy expiring old data at a steady rate, or a workload being drained ahead of a migration.
The distinction matters for forecasting. Retention expiry will flatten once the backlog clears; a migration will stop when the move completes. Neither continues indefinitely, so extending the observed slope will understate future consumption.
Common actions
- Use All for the baseline, then a shorter preset for the current rate. The two together separate long-run trend from what is happening now.
- Save the view so the same window is used each review rather than a different one each time.
- Read this beside the cost trend. Storage consumption falling while storage cost holds steady points at a tier or redundancy change rather than a genuine saving.
Tips
A single series on an all-platforms chart means only one cloud platform is being collected. That is a collection-coverage fact, not a chart limitation.
Related screens
Storage by Device Type gives the same storage question as a point-in-time split. Cloud Growth Overview attaches cost to the resources behind the consumption. Storage Trends is the on-premises equivalent.