

Financial Administration Report
Financial Administration is the ledger underneath every other cost number in the product. One row per physical asset, decomposed into acquisition, maintenance, power, floor space, and personnel, then normalized down to a cost per unit per day. If you want to know where a dollar figure elsewhere in FinOps came from, it came from here.
What this screen shows
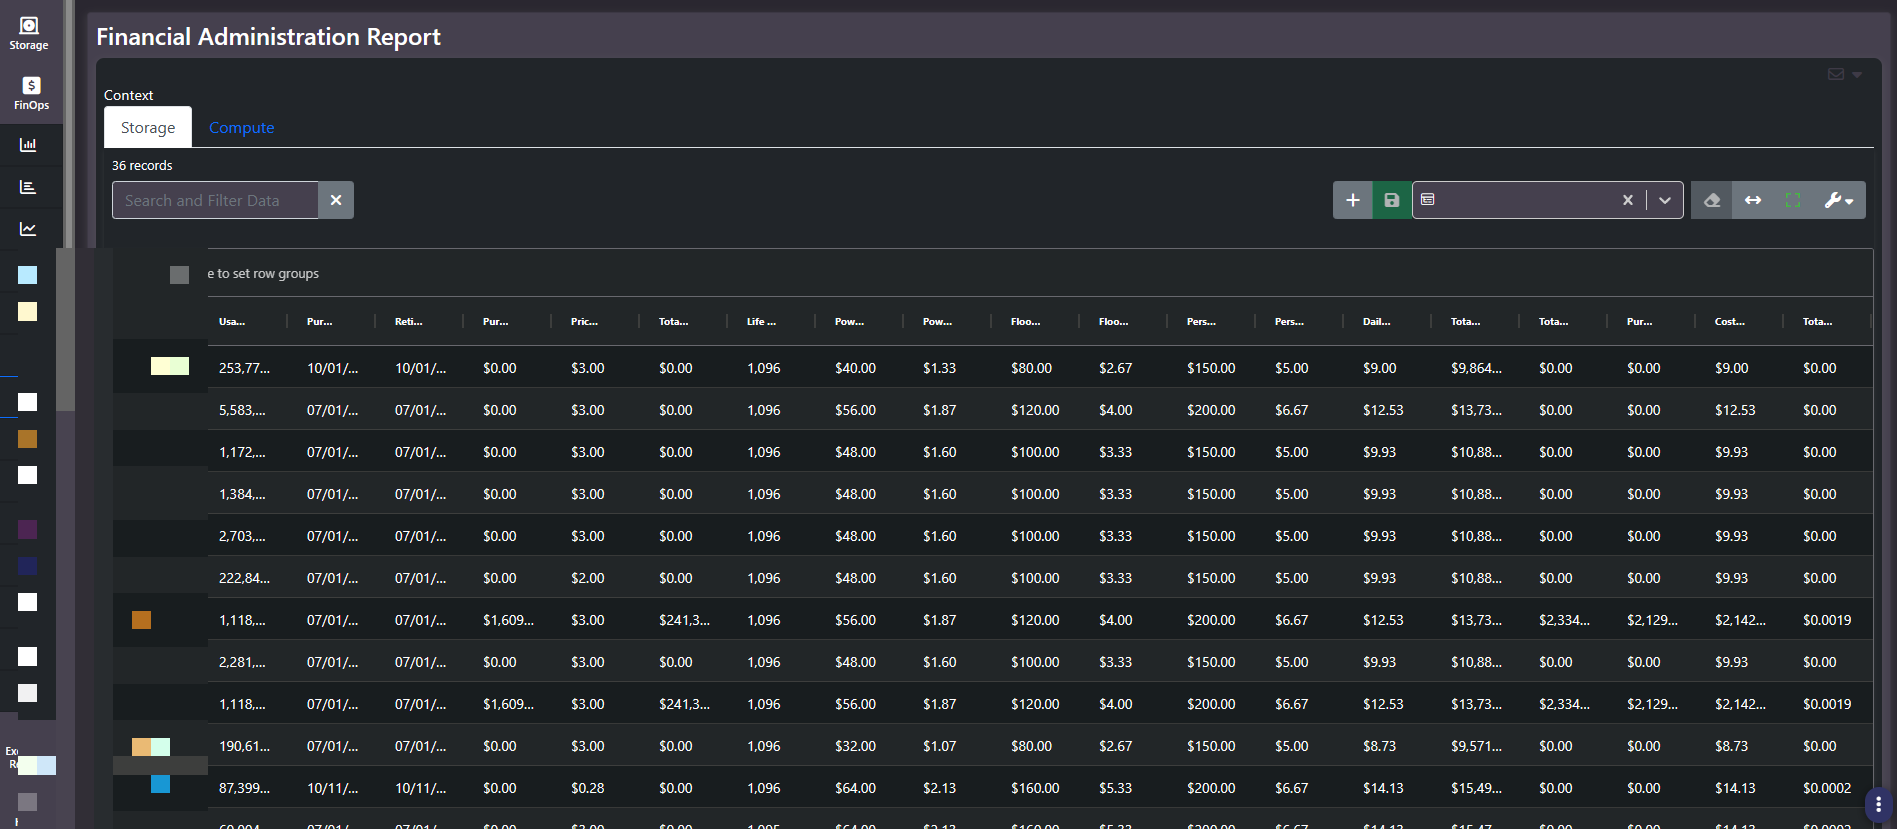
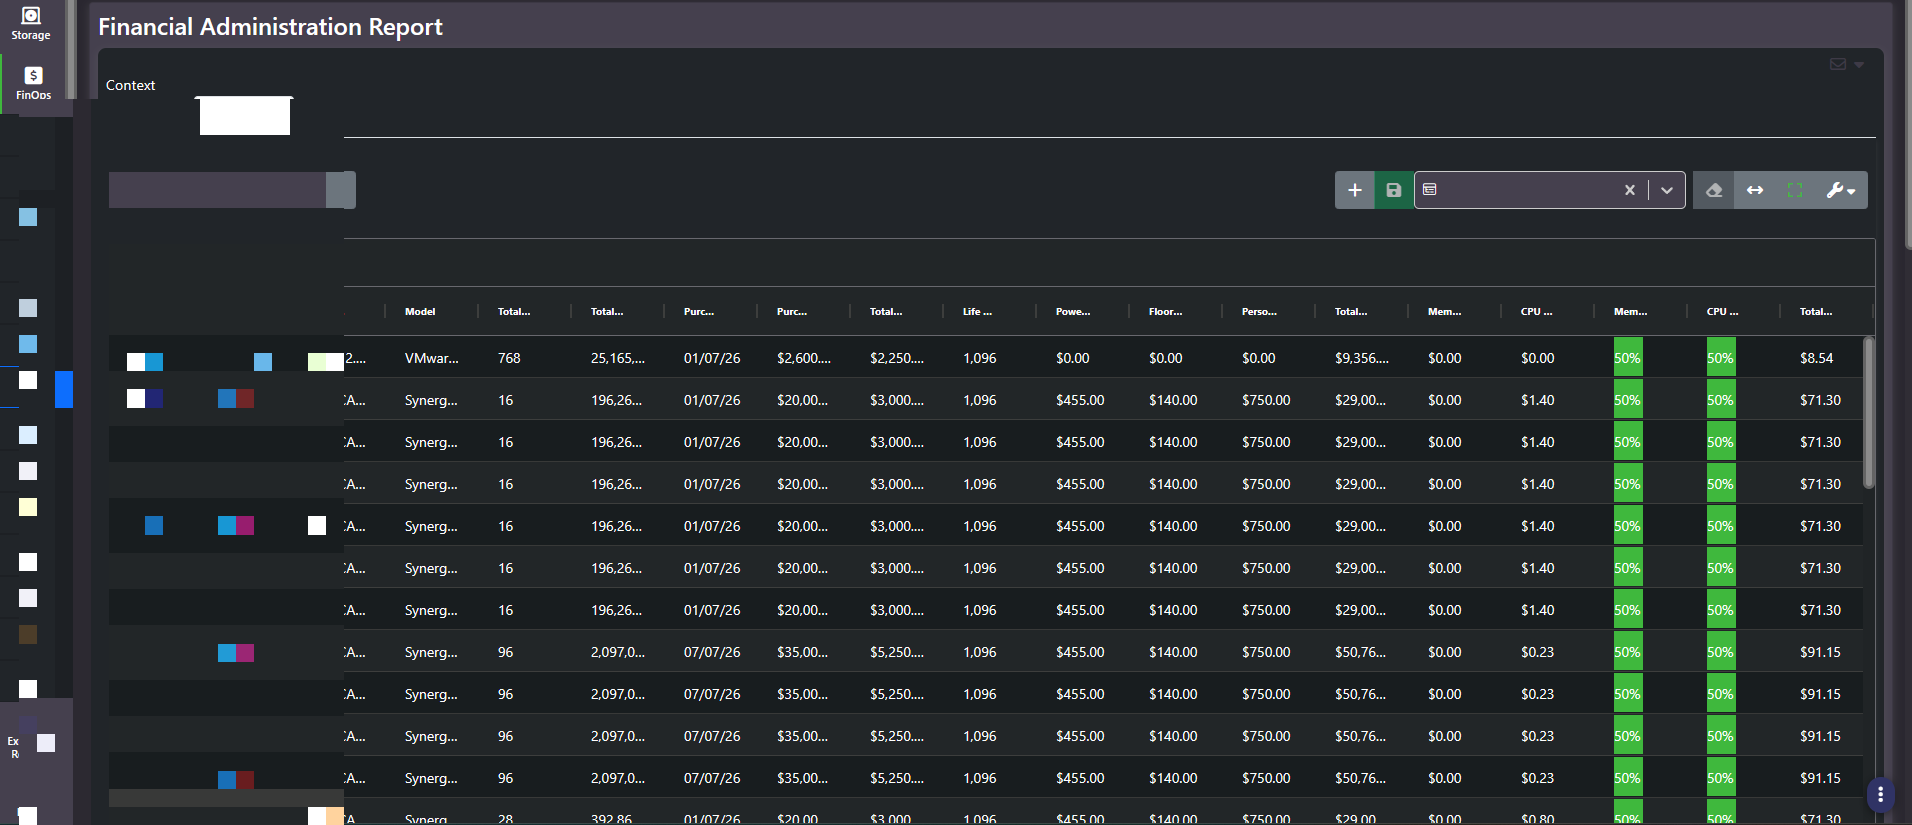
No charts. Two context tabs, Storage and Compute, each rendering a wide detail grid. The context is carried in the URL, so a filtered view is shareable. Storage shows one row per array. Compute shows one row per ESX host, with its vCenter, cluster, and hardware model.
How a daily cost is built
| Derived value | How it is calculated |
|---|---|
| Life of asset (days) | Retired Date minus Purchase Date |
| Daily Operating Cost | Power cost per day plus floor space cost per day plus personnel cost per day |
| Total Operating Cost | Daily Operating Cost across a full year |
| Purchase Cost per Day | Total Acquisition Cost divided by life of asset in days |
| Cost of Asset per Day | Daily Operating Cost plus Purchase Cost per Day |
| Total Cost per GiB per Day | Cost of Asset per Day divided by usable capacity in GiB |
The last row is the one that earns its place. Cost per GiB per day is the only figure on this screen that compares fairly across assets of different sizes and different ages. A large array with a high total cost can be more efficient than a small one, and this column is where that shows up.
Compute allocation
In the Compute context, each host’s daily cost splits between CPU and memory using the CPU Cost % and Memory Cost % columns, commonly configured as an even split. That split is what makes VM-level chargeback possible: a virtual machine’s share of its host depends on whether it is CPU-heavy or memory-heavy, and the allocation percentages set the exchange rate.
Columns hidden by default
Both contexts expose additional fields through the Columns side panel that are not in the default view, including capacity, performance, and cost-efficiency scores, and their internal equivalents. Compute adds retirement date, life of asset in years, daily acquisition cost, and core and memory scores. These are the inputs behind the efficiency scoring elsewhere in FinOps, and they can be added as columns or used as grid aggregations.
Note: The power, floor space, and personnel figures here come from the defaults configured on the Operating Cost settings screen. If a device’s daily cost looks wrong, check the settings before questioning the report. Garbage defaults propagate into chargeback, efficiency scoring, and every savings estimate downstream.
Why this screen is unit economics
A storage array never issues an invoice, and this is the screen where that gap closes. Every cost component for every physical asset, acquisition, maintenance, power, floor space, and personnel, breaks down into a daily rate, and those rates resolve to a normalized cost per unit per day that is directly comparable to a cloud price per gigabyte.
That comparability is what makes the number defensible in front of an auditor and actionable for an engineer at the same time. For compute, the same decomposition runs to CPU cost per day and memory cost per day, which is what allows a virtual machine’s share of its host to be priced according to whether it is CPU-heavy or memory-heavy.
Because these rates roll up through the allocation layer, the question they answer changes. It stops being what does this array cost and becomes what does this service cost, which is the link product needs between infrastructure spend and the value of what the organization sells.
Editing the inputs
- Per-device overrides. Floor space, personnel, purchase price, power, and maintenance are all editable, and the calculated result can be overridden with a manual price per gigabyte where a negotiated or known rate should win.
- Bulk edits. Where an assumption applies across a whole hardware class rather than one asset, it can be applied in bulk instead of row by row.
- CSV in and out. The grids export and import as CSV, and an export carries whatever grouping and filtering you configured in the grid window rather than resetting to the default view.
- Column display. With this many columns the default view truncates header names. That truncation can be turned off when you need to read the full build.
Where ServiceNow holds the asset record, these values come from asset management directly rather than being maintained here by hand.
Related screens
Amortization Report plots the depreciation implied by these purchase and retirement dates. Cost Efficiency Dashboard scores assets using the fields hidden in this grid. Chargeback Report takes these per-asset costs and allocates them to tags.