

Storage Environment
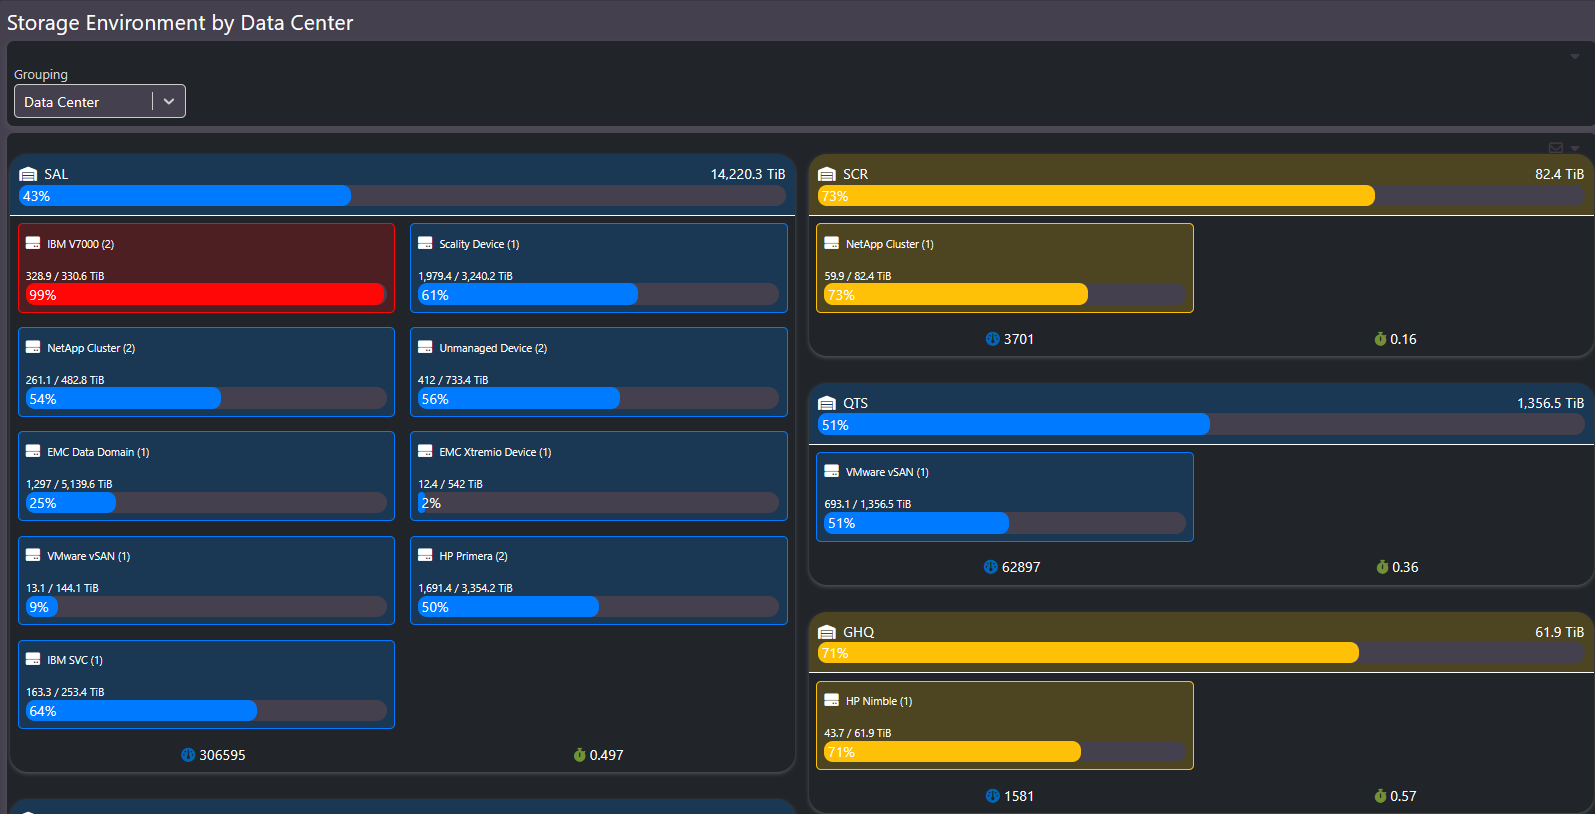
A heat map of the whole estate by data center, sized by capacity and colored by health.
Storage Environment is the screen for the big picture: every data center, every device group, one view. Block size shows how much capacity lives there. Color shows health, driven by weighted alert status rather than a single threshold, so a large red block is a large problem and a small red block is a small one.
What this screen shows
Each data center appears as a panel containing its device groups, with total capacity, per-group capacity, and utilization bars. The grouping selector changes the top-level breakdown. Health coloring is weighted by alert severity, so a device with critical alerts reads differently from one with informational alerts.
When to use it
- Orientation. A new executive or a new team member gets the shape of the whole environment in one look: which data centers are big, which are stressed, and where the risk concentrates.
- Migrations. As workloads move between platforms or sites, the blocks shift size over time, making migration progress visible without a spreadsheet.
Related screens
From a block that looks wrong, go to Enterprise Summary for the device detail behind it, or Storage by Group for the same grouping logic in chart form.