

Administrative Report
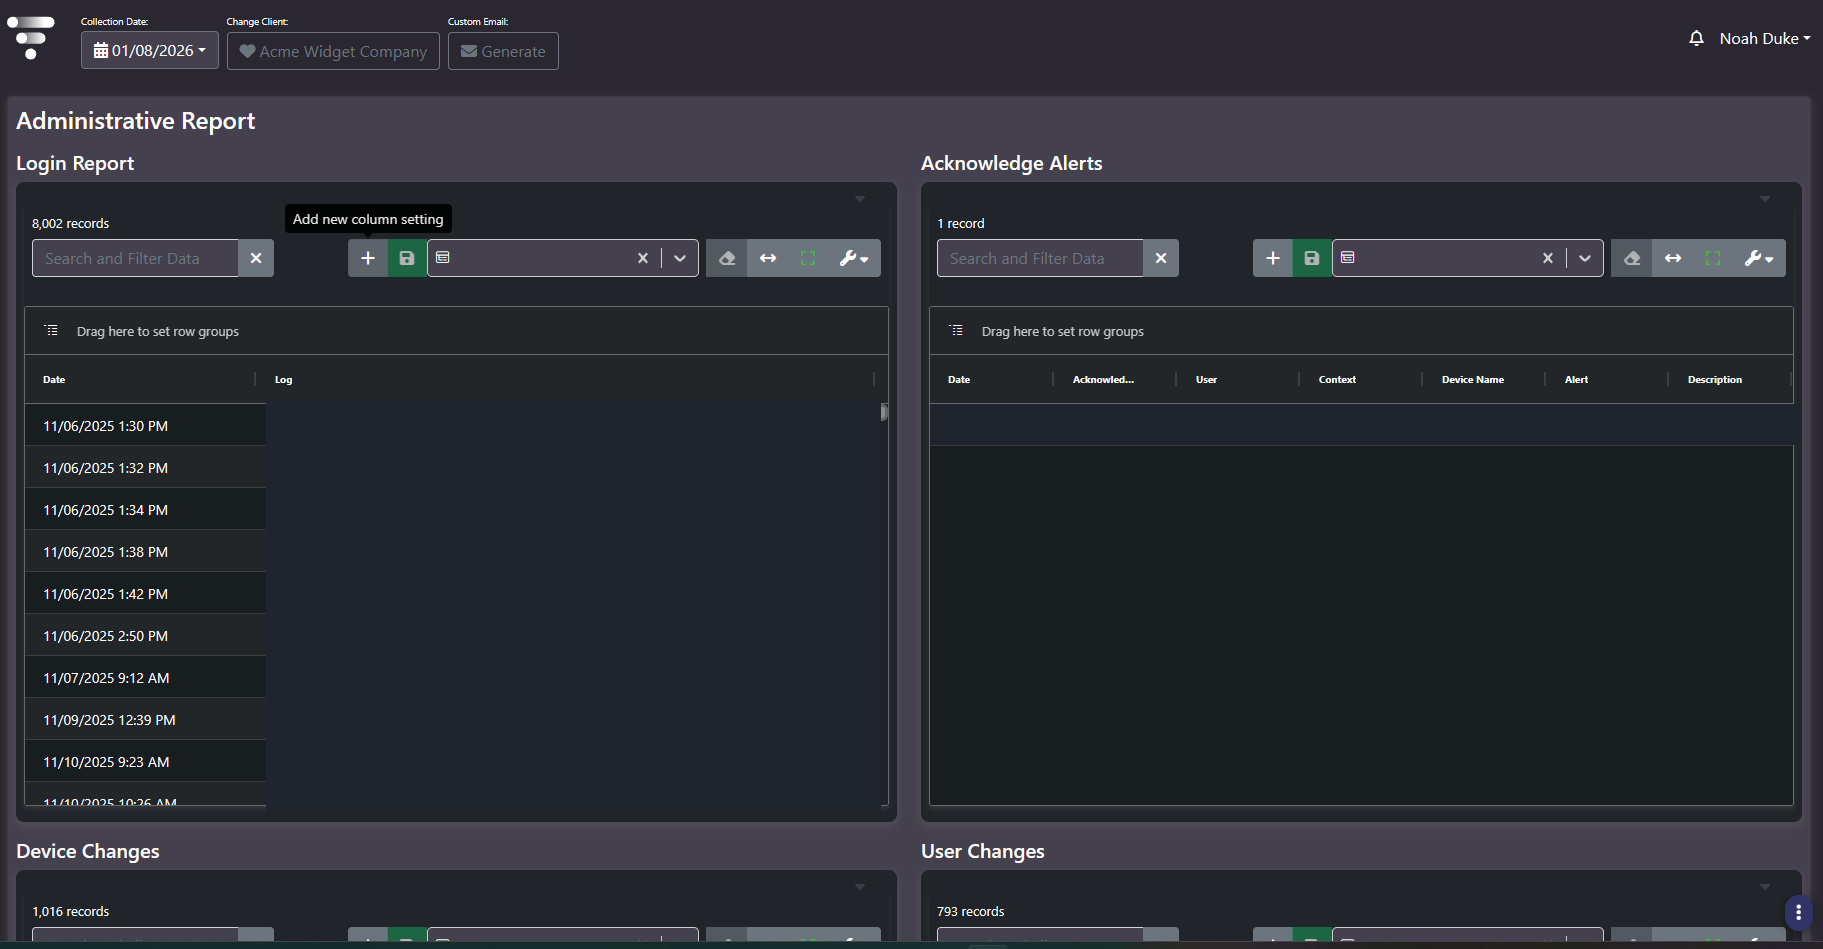
Purpose: The platform audit trail. Four grids covering logins, alert acknowledgments, device configuration changes, and user changes. When someone asks who did what and when, this is the screen that answers it.
When to use it
- Respond to an audit or compliance request for administrative activity over a period
- Evidence that platform access was granted and revoked deliberately
- Account for configuration drift before interpreting a trend or delta report covering the same window
- Show that raised alerts were reviewed by a named person rather than left open
Key areas and metrics
| Panel | What it records |
|---|---|
| Login Report | Every platform login, as a timestamp and a log entry naming the account. Typically the highest-volume grid on the screen, running into thousands of records |
| Acknowledge Alerts | Who acknowledged which alert, and what the alert was |
| Device Changes | Configuration changes made against collected devices |
| User Changes | Changes to platform user accounts and their permissions |
Each panel carries its own record count in the top left, which is the quickest read on the screen. A Device Changes count in the thousands over a review period means the estate is being actively reconfigured, and that is worth understanding before interpreting any capacity or cost trend across the same dates.
Acknowledge Alerts columns
Date, Acknowledged By, User, Context, Device Name, Alert, and Description. Because it carries both the alert and the person who cleared it, this panel is the counterpart to the acknowledgment controls on the health alert screens: those let you clear an alert, and this is where the clearing is recorded.
Grid controls
All four panels use the same analytical grid found throughout the platform.
- Search and Filter Data. Free-text match across the grid, with a clear button.
- Column settings. Add a new column setting, save it, and recall saved configurations from the selector beside it.
- View controls. Clear filters, fit columns, and full screen, to the right of the selector.
- Settings. A wrench menu holding the remaining grid options.
- Row grouping. A drag zone above the header row. Dropping a column header there collapses the grid into groups.
Common actions
- Set the Collection Date to cover the period under review.
- Group the Login Report by account to turn thousands of individual events into an access pattern, or by date to turn them into an activity timeline.
- Use User Changes to evidence deliberate access administration.
- Use Device Changes to account for configuration drift in the same window.
- Use Acknowledge Alerts to show raised conditions were owned and cleared.
Tips
Row grouping is what makes the Login Report usable. Thousands of raw login events are not a report; the same events grouped by account or by date are.
Every panel here contains named individuals and their activity timestamps. Exports are personal data. Scope them to the period actually requested and handle them accordingly.
Related screens
Security Dashboard finds the identity and credential issues this screen evidences the response to. Storage Delta Report and Virtual Delta Report quantify what the recorded device changes did to the estate.