

Backup Host Occupancy
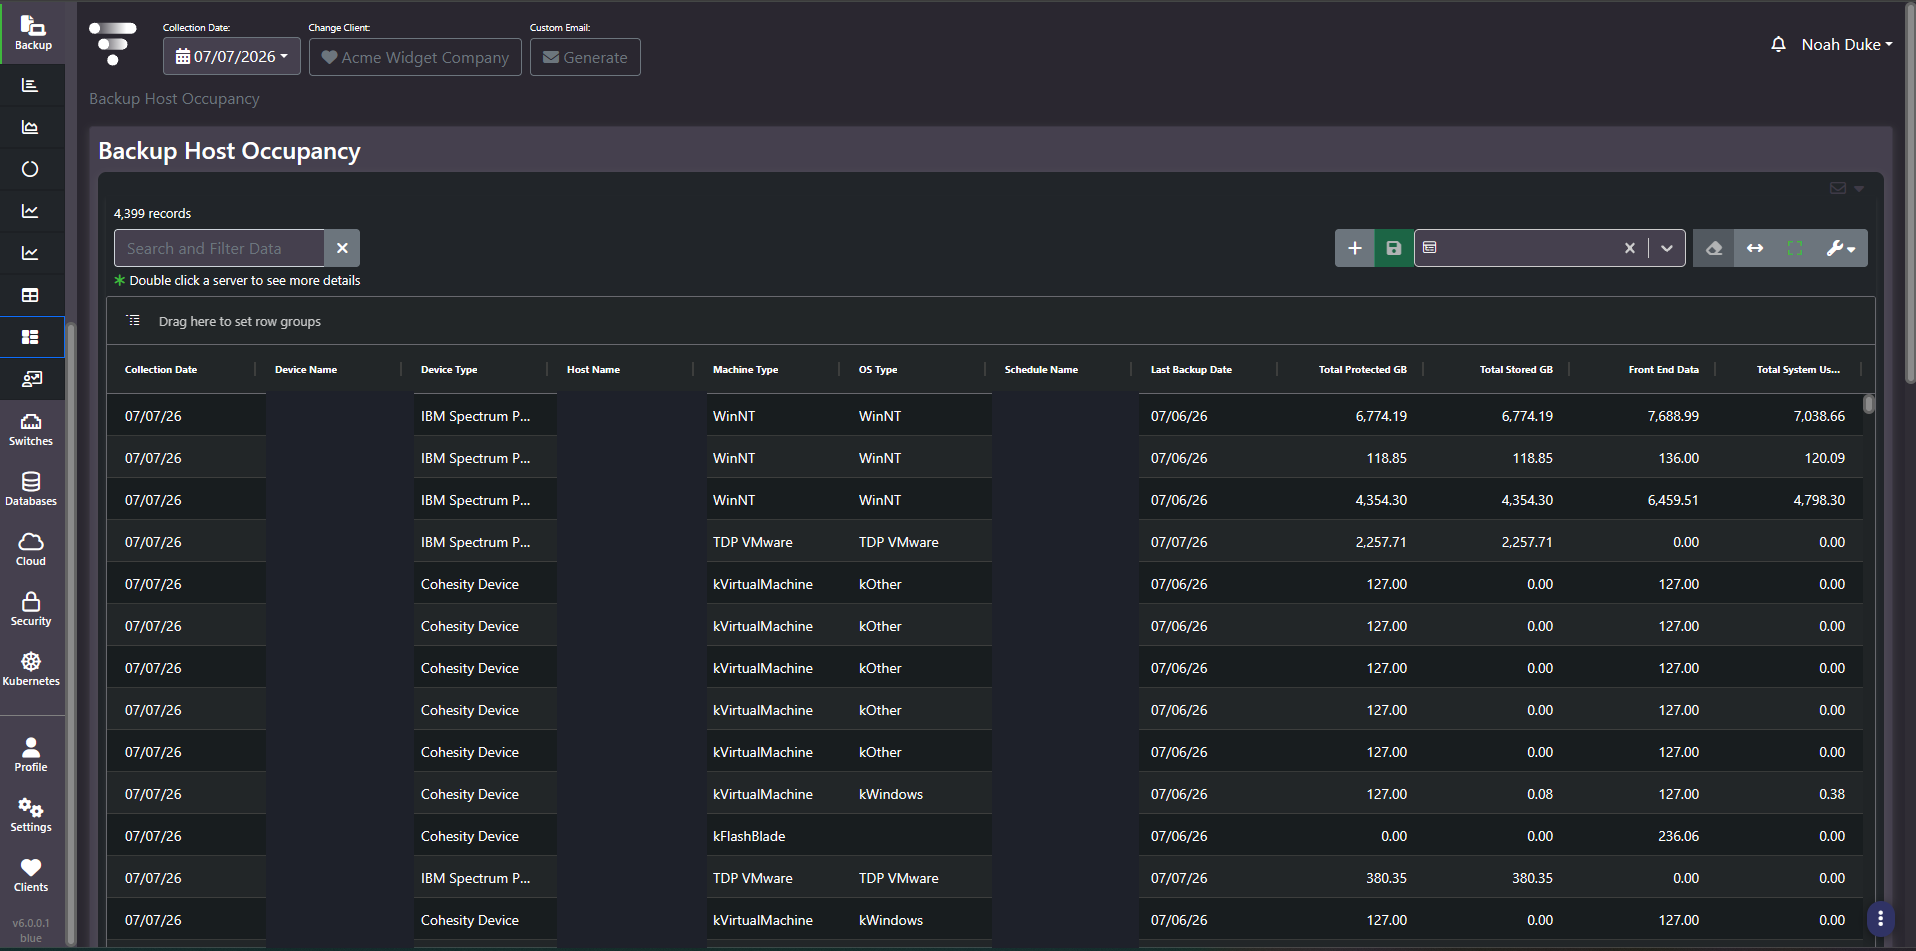
Purpose: Who is consuming the backup capacity. One row per protected client per schedule, with protected and stored capacity, front-end data, machine and OS type, and the last backup date. It is the chargeback and rationalization view of backup.
When to use it
- Find the clients consuming the most backup capacity
- Measure deduplication effectiveness per client
- Attribute backup capacity to a team, application, or business unit
- Spot clients whose last backup date has slipped
Key areas and metrics
| Column group | Columns |
|---|---|
| Identity | Collection Date, Device Name, Device Type, Host Name, Machine Type, OS Type, Schedule Name |
| Currency | Last Backup Date |
| Capacity | Total Protected GB, Total Stored GB, Front End Data, Total System Usage |
Helper text above the grid notes that double-clicking a server opens more detail for it. Row counts run high, because a client appears once per schedule it belongs to rather than once overall.
Protected against stored is the deduplication ratio
Total Protected GB is how much data the client presents for backup. Total Stored GB is how much capacity it actually occupies after deduplication and compression. The gap between them is the efficiency the backup platform is achieving on that client.
- Stored well below protected. Deduplication is working. Common for VM images and file servers with repeated content.
- Stored equal to protected. No reduction. Typical for already-compressed or encrypted data, and expected rather than wrong.
- Stored at zero with protected above zero. The client’s data is being counted but not stored on this device, usually because it is deduplicated against a global store or tiered elsewhere.
This matters for chargeback. Billing a business unit on protected data charges them for what they presented; billing on stored data charges them for what they consume. Those produce very different invoices, and the choice should be deliberate.
Common actions
- Sort by Total Stored GB descending for the clients actually filling the pools.
- Group by OS Type or Machine Type to see which platform families dominate consumption.
- Group by Schedule Name to attribute capacity to a policy rather than a machine.
- Sort by Last Backup Date ascending as a standing check for clients that have quietly stopped being protected.
- Double-click a row for the per-server detail.
Tips
Do not sum capacity across the unfiltered grid. A client appearing under several schedules contributes several rows, so totalling the column overcounts. Filter to one schedule, or group and read the group totals.
Related screens
Backup Pool Summary shows the pools this consumption fills. VM Audit Report answers whether a client is protected at all rather than how much it stores. Chargeback Report is where backup capacity becomes an allocated cost.