

Tag Cost Modeling
Tag Cost Modeling is the what-if sandbox. Define a workload that does not exist yet, attach it to a tag, and see what it would cost per day, per month, and per year before anyone provisions anything. It is the only editable screen in the FinOps section; everything else reports on what is already there.
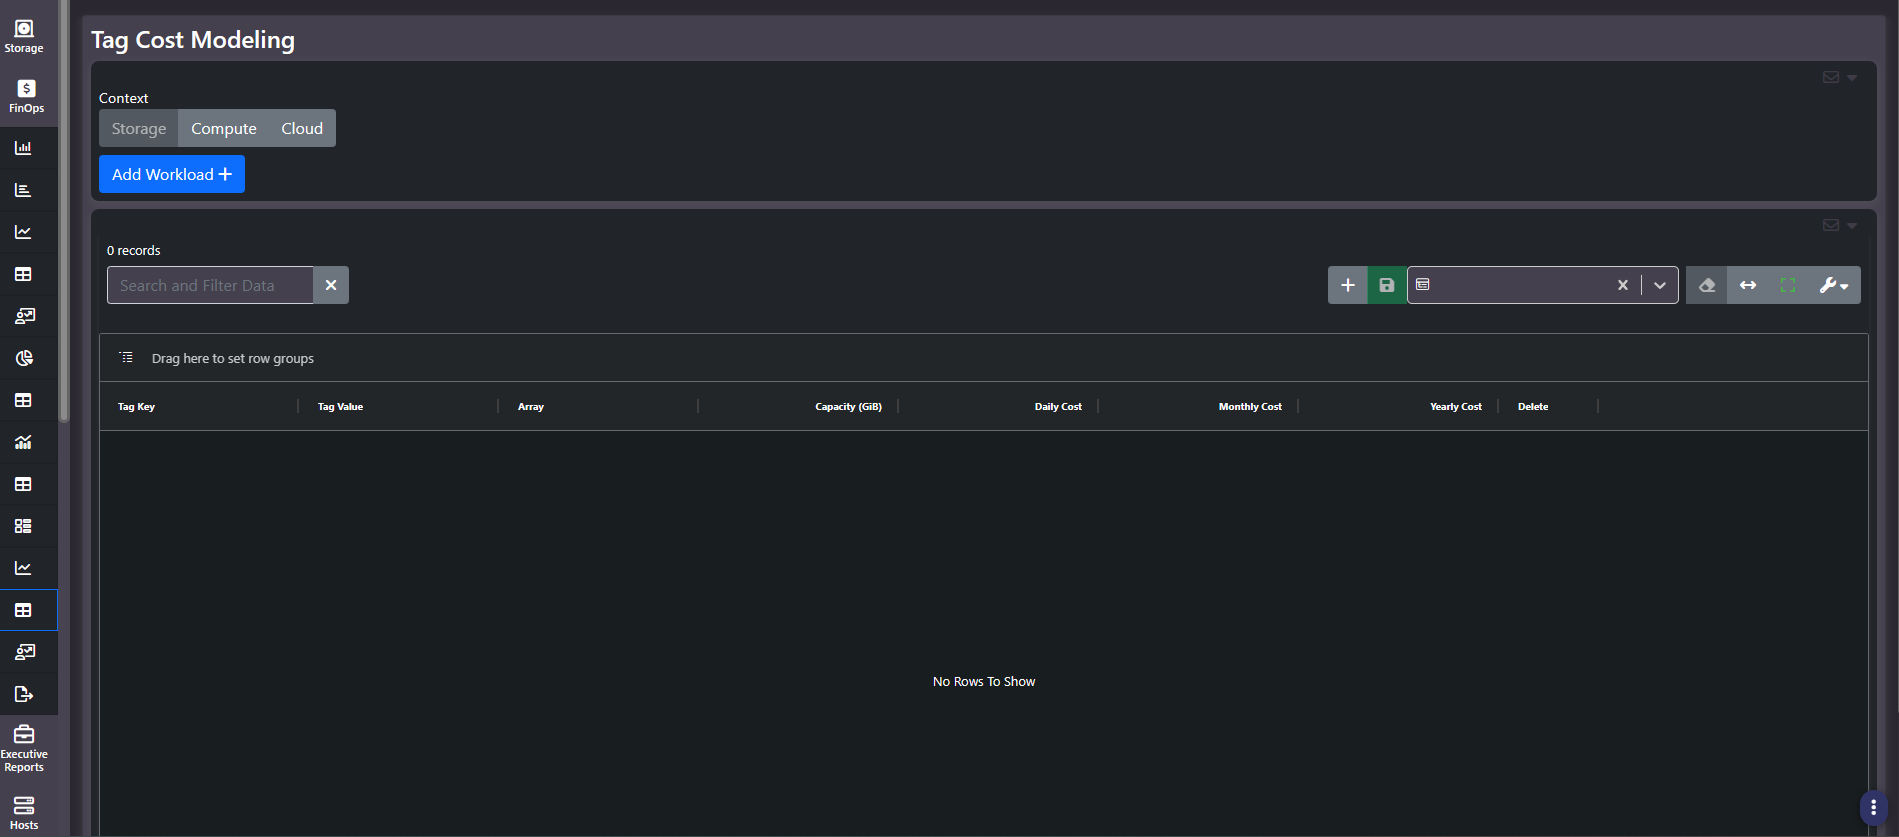
What this screen shows
Three context tabs, Storage, Compute, and Cloud, each with its own grid of modeled workloads and its own schema. An Add Workload button opens a creation modal, and each row carries a delete control.
| Context | Grid columns |
|---|---|
| Storage | Tag Key, Tag Value, Array, Capacity (GiB), Daily Cost, Monthly Cost, Yearly Cost |
| Compute | Tag Key, Tag Value, Cluster, vCPUs, Memory (GiB), Daily Cost, Monthly Cost, Yearly Cost |
| Cloud | Tag Key, Tag Value, vCPUs, Memory (GiB), Storage (GiB), Daily Cost, Monthly Cost, Yearly Cost |
Adding a workload
The storage variant of the modal asks for an existing tag key, a new tag value, the target array, capacity in GiB, and a rate expressed as dollars per GiB per day. As you fill it in, an estimated cost preview updates live and shows the daily figure alongside its monthly and yearly extensions. Compute and cloud modals follow the same pattern against their own fields.
Because you supply the rate, the model is only as good as the rate you give it. Pull a realistic one from the cost-per-GiB-per-day column on the financial ledger for a comparable array rather than guessing.
When to use it
- Pricing a project before approval. A business unit asks for capacity. Model it, tag it to them, and the number is in the same units as the chargeback report they already receive.
- Comparing placement options. Model the same workload against a storage array, a cluster, and a cloud footprint, then compare the yearly figures.
- Sanity-checking a quote. A vendor proposal quotes capital cost. This gives you the fully-loaded annual figure to set against it.
Tip: Modeled entries persist until deleted and can carry very large projected figures. Clear out abandoned scenarios, and keep modeled tag values visibly distinct from real ones so nobody mistakes a hypothetical for a live allocation.
How modeling feeds the forecast
A forecast built only on historical patterns misses the thing finance cares about most, which is planned change. A workload modeled here becomes part of the anticipated future cost rather than appearing as a surprise once it is provisioned, so this screen is what closes that gap.
The effect is not confined to FinOps. Modeled workloads persist, and engineering sees the incoming demand in capacity planning on the storage, virtual, and compute side, so the capacity conversation and the cost conversation are working from the same planned change instead of two versions of next quarter.
Note: This is planning and estimating, and the split of roles usually follows that: engineering models the workload, product defines what gets built, and finance approves it. The live cost preview exists so that approval happens before anything is provisioned.
Related screens
Financial Administration is where to source a realistic rate. Tag Forecasting covers the opposite case: projecting a workload that already has history. Chargeback Report is where the workload lands once it is real.