

Host LUNs
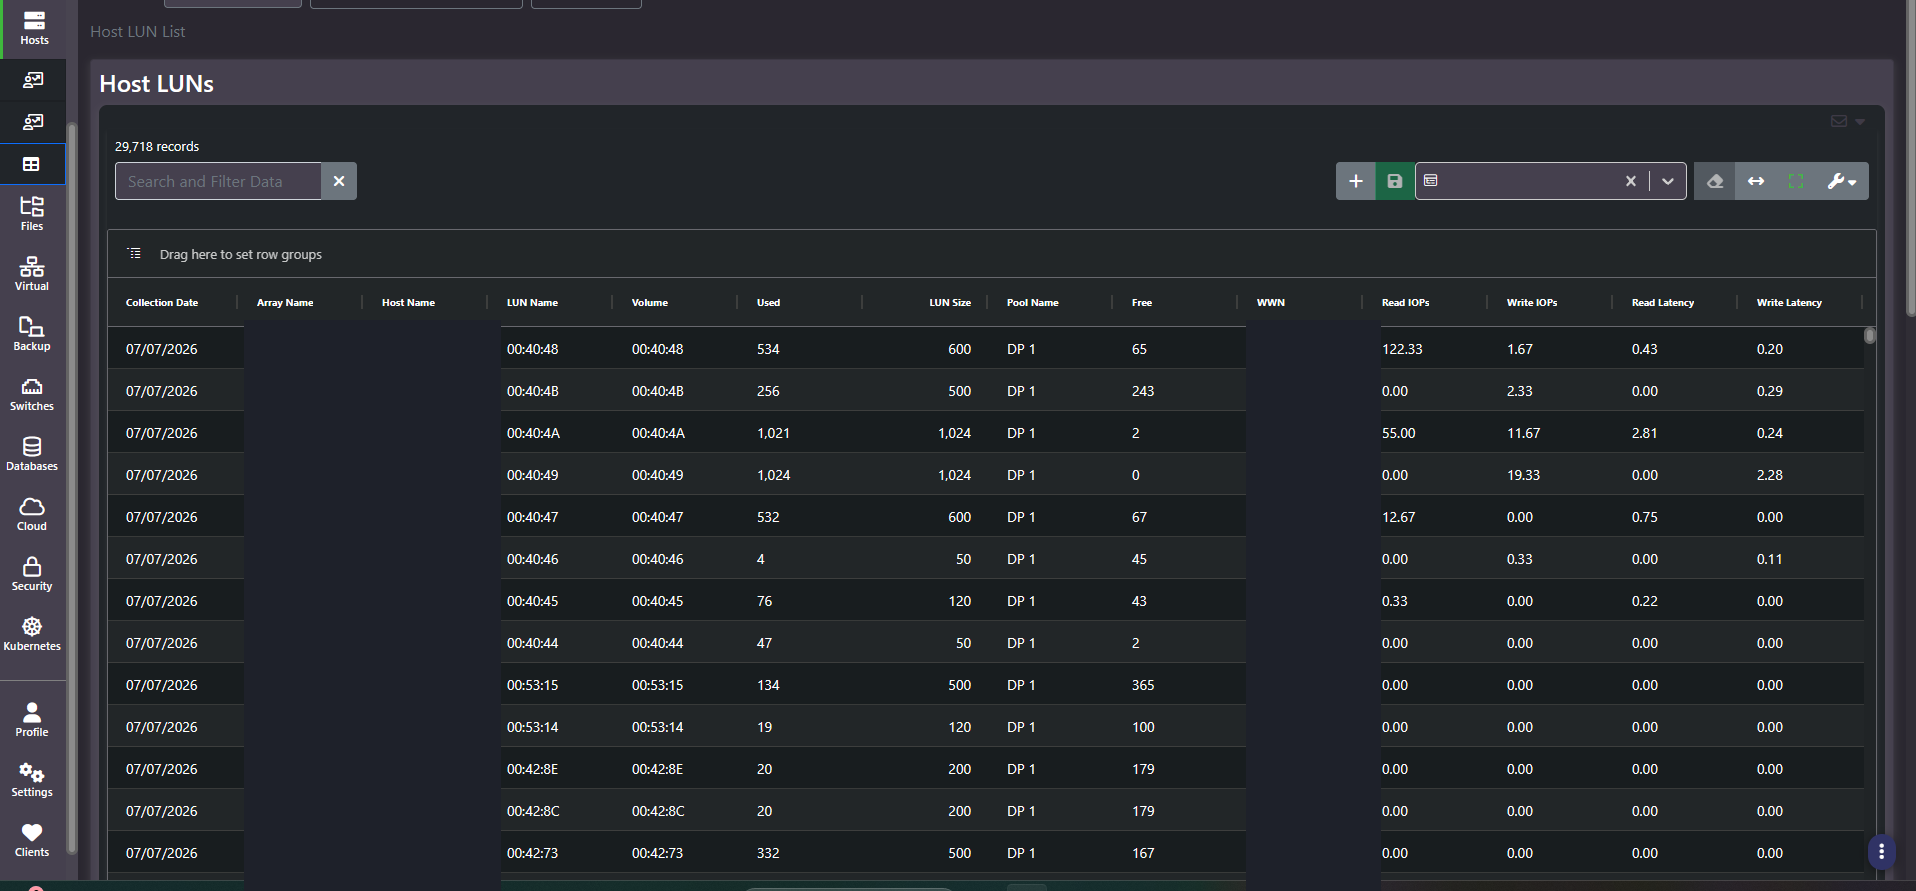
Purpose: Every LUN presented to every host, with its array, pool, capacity, world wide name, and read and write performance. It is the most granular view in the section and the screen a storage problem eventually resolves to.
When to use it
- Identify the specific LUN behind a host’s latency problem
- Find LUNs at or near full where the host still reports headroom overall
- Separate a read problem from a write problem
- Trace a LUN back to its pool and array during an incident
Key areas and metrics
| Column group | Columns |
|---|---|
| Identity | Collection Date, Array Name, Host Name, LUN Name, Volume, WWN |
| Placement | Pool Name |
| Capacity | Used, LUN Size, Free |
| Performance | Read IOPs, Write IOPs, Read Latency, Write Latency |
Record counts are large, because the grid holds one row per LUN per host mapping per collection date. Filter before browsing.
Read and write are separate diagnoses
Latency and IOPS are both split by direction here, and that split is the most useful thing on the screen. The two failure modes look identical in an aggregate latency figure and have different causes.
- High read latency, low write latency. Usually a cache or media problem: reads are missing cache and hitting slower media.
- High write latency, low read latency. Usually a back-end problem: pool contention, parity overhead, or replication acknowledgment.
- Both high with low IOPS. The LUN is not busy, so the delay is between host and array. Look at the fabric.
- Both high with high IOPS. The LUN is genuinely working hard and needs faster placement or less load.
Watch for LUNs at zero free
A LUN where used equals size and free is zero is full, regardless of how healthy the host looks in aggregate. A host with several LUNs can report comfortable total utilization while one of its LUNs has no room at all, and that is the one the application will fail on.
Common actions
- Filter to one host before anything else, then sort its LUNs by latency.
- Filter Free to zero as a standing check for individually full LUNs.
- Group by Pool Name to see whether slow LUNs share a pool, which points at pool contention rather than a LUN problem.
- Use the WWN to correlate a LUN with fabric and array-side records during an incident.
Tips
Zero across all four performance columns means the LUN saw no activity in the collection window, not that it is fast. Many LUNs sit idle, and reading them as high-performing is a common misreading of this grid.
WWNs uniquely identify SAN endpoints. Together with host and array names they are enough to map a fabric, so redact all three before sharing.
Related screens
Enterprise Host Summary is where a problem host is identified. All Units covers the same LUNs from the array side, with pool and volume context. Switch Health Alerts covers the fabric when both read and write latency are high at low IOPS.