

Enterprise Host Summary
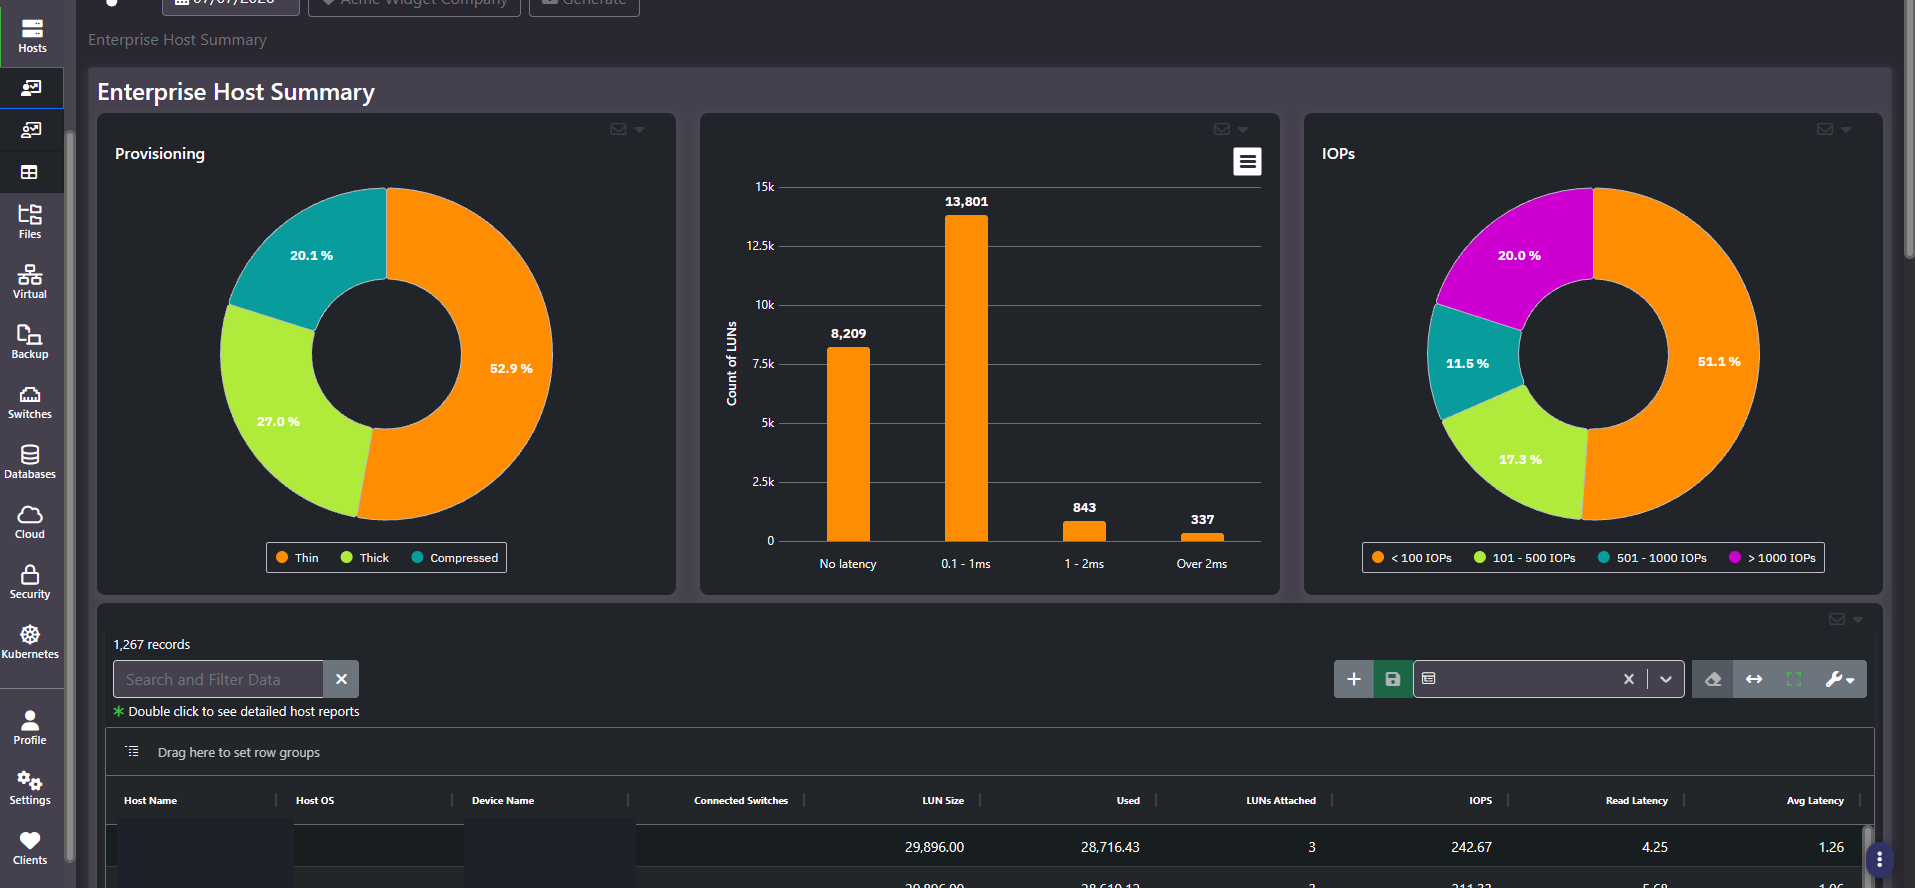
Purpose: The host estate in three distributions and one grid. How storage is provisioned, how many LUNs sit in each latency band, how IOPS are distributed, and then every host with its own capacity and performance figures.
When to use it
- Establish how much of the estate is thin, thick, or compressed provisioned
- Find the LUNs and hosts sitting in the worst latency bands
- Identify which hosts actually drive IOPS, as opposed to which hold the most capacity
- Check how many switches each host is connected to as a redundancy audit
Key areas and metrics
| Panel | What it shows |
|---|---|
| Provisioning | Donut splitting capacity across Thin, Thick, and Compressed |
| Latency histogram | Count of LUNs in bands: no latency, 0.1 to 1ms, 1 to 2ms, and over 2ms |
| IOPs | Donut splitting hosts across bands: under 100, 101 to 500, 501 to 1000, and over 1000 IOPs |
The IOPS donut is the one to read first
Most host estates are heavily skewed: roughly half the hosts do almost no I/O while a fifth generate most of it. That shape has direct consequences. The low-IOPS majority are candidates for cheaper tiers and are safe to consolidate. The high-IOPS minority are the only hosts where flash placement, path count, and array choice actually matter.
The latency histogram is the same insight from the other direction. A large count in the no-latency band alongside a small count over 2ms means the problem is concentrated, not systemic, and the fix is targeted rather than an array purchase.
The host grid
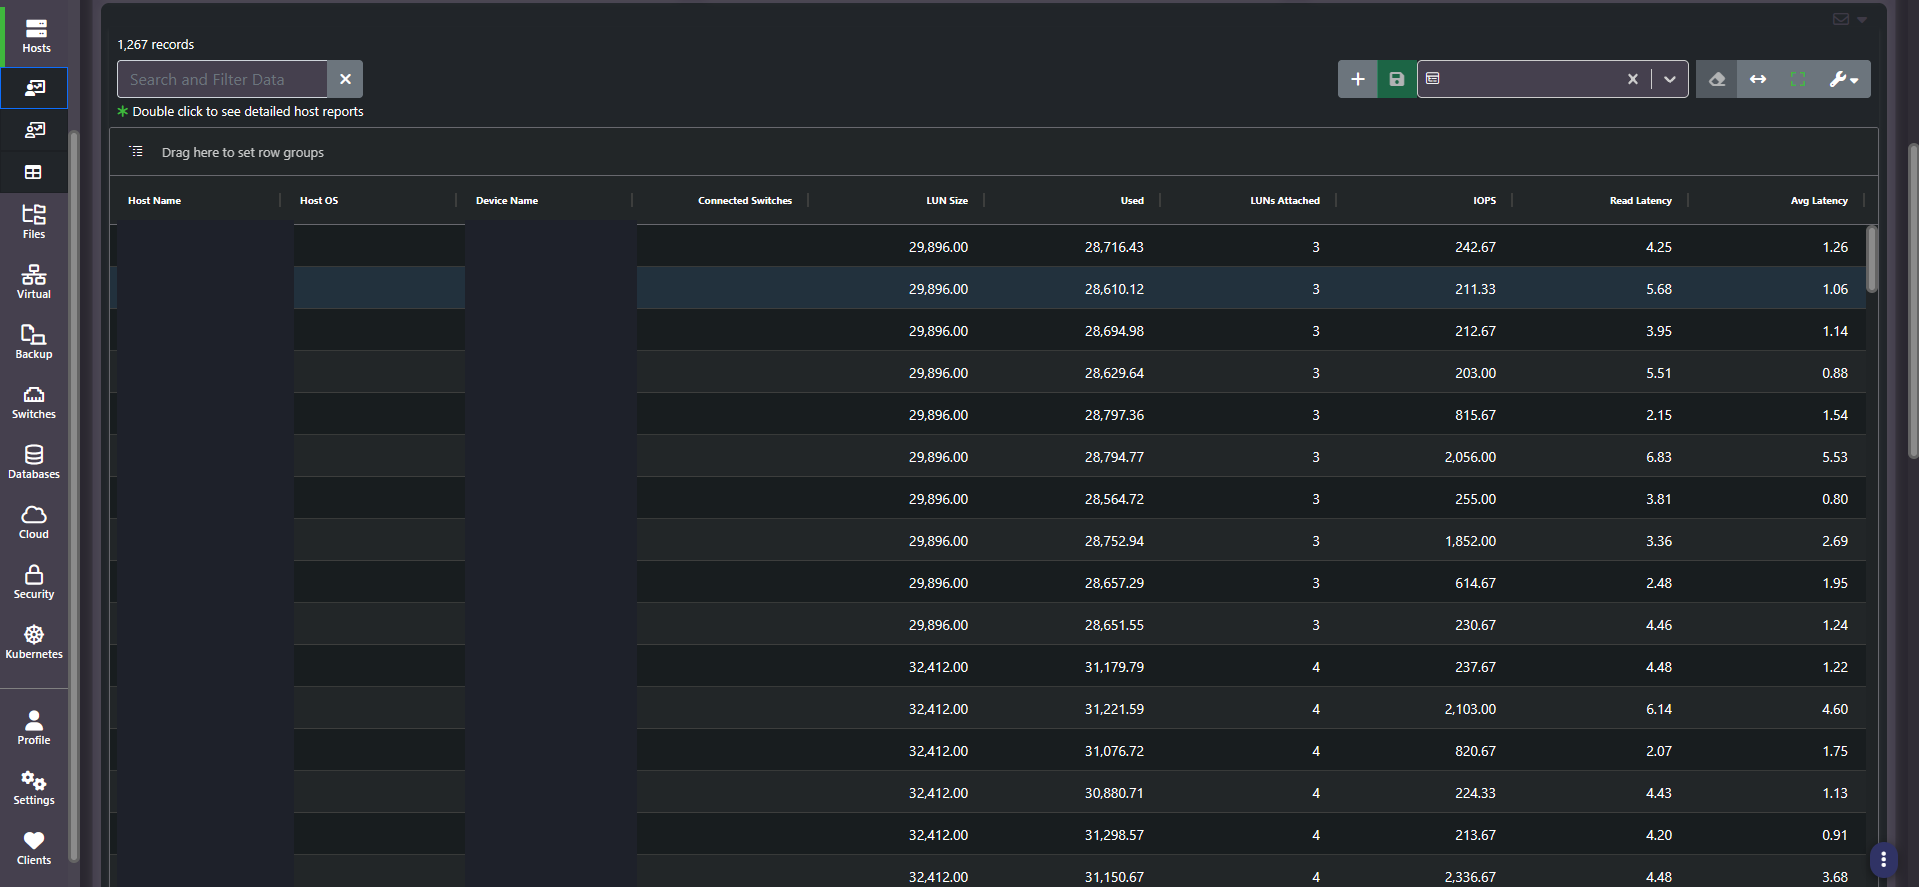
Columns are Host Name, Host OS, Device Name, Connected Switches, LUN Size, Used, LUNs Attached, IOPS, Read Latency, and Avg Latency. Helper text notes that double-clicking opens detailed host reports.
Connected Switches is the column worth a dedicated pass. A host showing a single connected switch has no fabric redundancy, and that is a resilience finding no capacity or performance report will ever surface.
Common actions
- Sort by Avg Latency descending for the hosts actually suffering, then check IOPS on the same row. High latency with low IOPS is a path or fabric problem, not a capacity one.
- Filter Connected Switches to one as a standing redundancy audit.
- Group by Device Name to see whether latency clusters on one array.
- Group by Host OS to spot a platform-specific multipathing or driver issue.
Tips
Many hosts sharing identical LUN sizes and identical attachment counts usually indicates a templated build. That is good news for troubleshooting, because a fix for one host applies to the whole group.
Related screens
Host LUNs is the per-LUN detail behind a problem host. Host and Device Capacity Modeling tests whether relocating the host would help. Enterprise SAN Switch Summary covers the fabric side of a latency problem.