

Databases Queries Performance
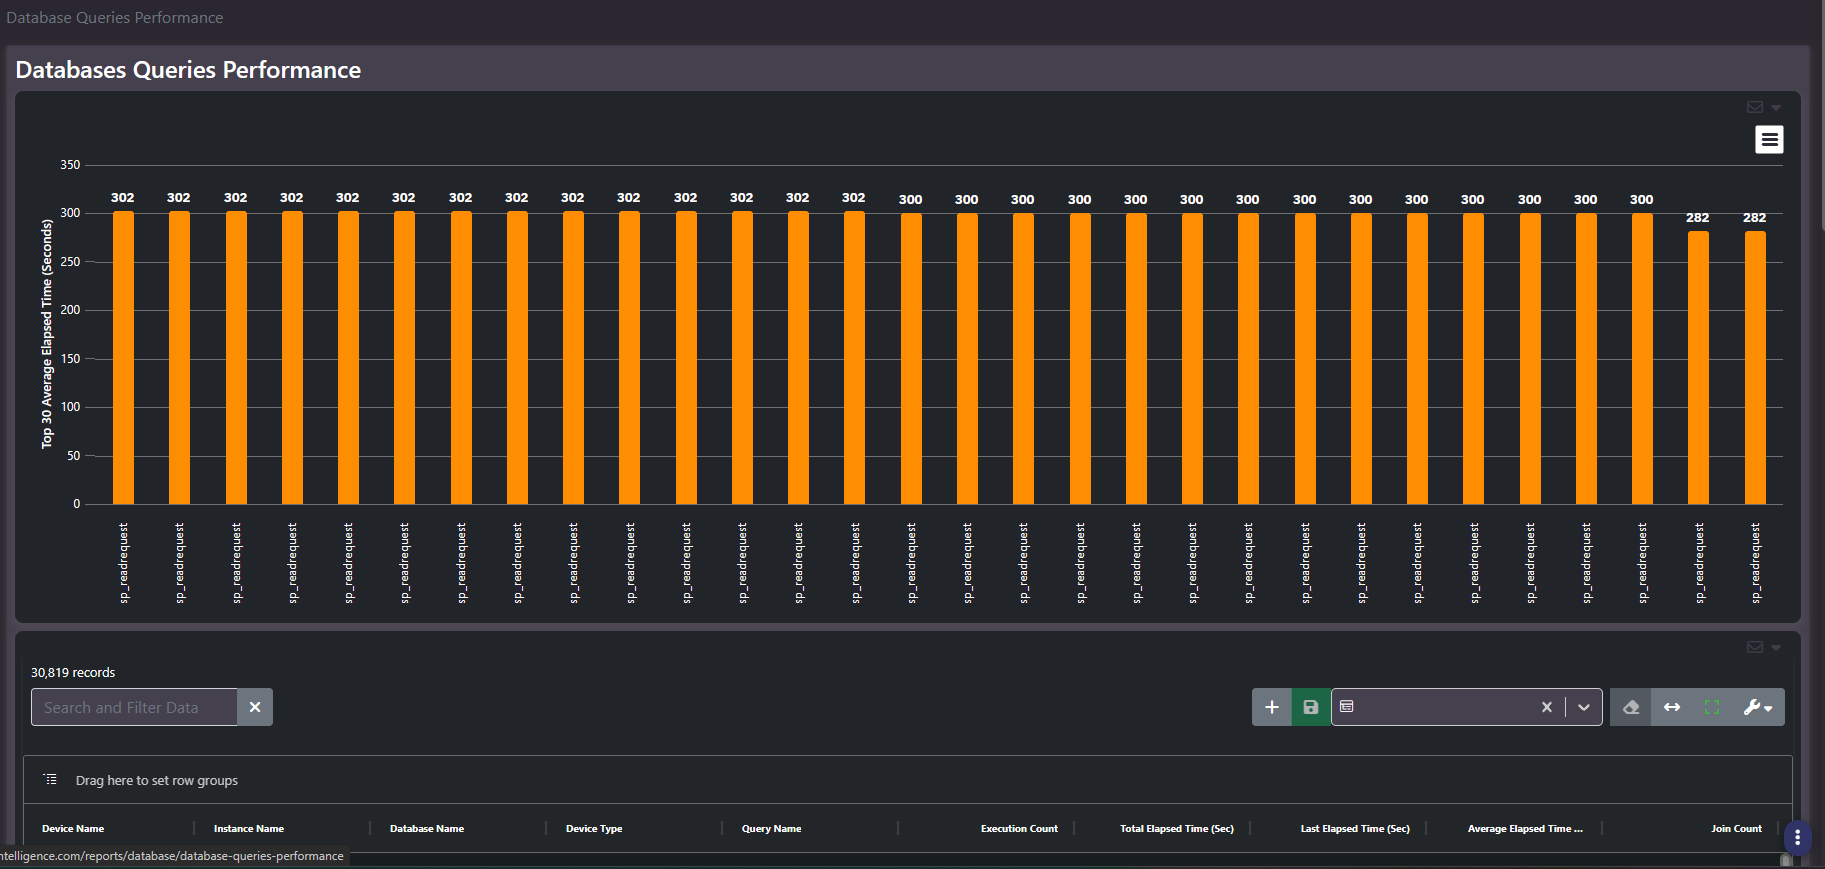
Purpose: The slowest queries in the estate. A ranked chart of the top thirty by average elapsed time, over a grid carrying execution counts and total, last, and average elapsed time per query.
When to use it
- Find the queries consuming the most database time
- Distinguish a slow query from a frequently-run moderate one
- Give a DBA a starting point backed by measured elapsed time
- Check whether a tuning change moved the average
Key areas and metrics
- Chart. Top thirty by average elapsed time in seconds, one bar per query name, with an export menu.
- Grid. Device Name, Instance Name, Database Name, Device Type, Query Name, Execution Count, Total Elapsed Time (Sec), Last Elapsed Time (Sec), Average Elapsed Time, and Join Count. Record counts run into the tens of thousands.
Total time matters more than average
The chart ranks by average elapsed time, which finds individually slow statements. It does not find the queries costing the estate the most time overall. A statement averaging half a second and running a million times a day consumes far more database time than one averaging five minutes and running twice.
Sort the grid by Total Elapsed Time instead. That is the ranking that identifies where tuning effort pays back, and it frequently surfaces queries that never appear in the chart at all. Use Execution Count alongside it to tell a genuinely expensive statement from a frequently-run cheap one.
Long-running system procedures crowd the chart
Some platform-internal procedures are designed to run for a long time. Mail and queue readers, agent pollers, and similar background routines sit blocked waiting for work, and their elapsed time reflects a polling interval rather than a performance problem.
Because they wait by design, they can occupy most or all of a top-thirty-by-average chart, pushing every real finding off it. A chart showing the same procedure name repeated across nearly every bar, all at a similar round-numbered duration, is this pattern rather than an estate-wide crisis. Filter the known system procedures out before reading the chart, or work from the grid sorted by total elapsed time.
Common actions
- Sort the grid by Total Elapsed Time descending as the default view rather than trusting the chart order.
- Filter out system and agent procedures so application queries are visible.
- Read Join Count on the worst offenders. A high join count with long elapsed time points at a query structure problem rather than a missing index.
- Group by Database Name to attribute database time to an application.
Tips
These figures come from the platform’s own query statistics, which reset on restart. Note instance uptime before comparing totals across instances, because a recently restarted server will look far healthier than one up for months.
Related screens
Missing Indexes often explains a slow query, and carries the optimizer’s own suggested fix. Index Fragmentation covers the case where the index exists but has degraded. Health Alerts raises wait-time conditions from the same underlying data.