

Databases Health Alerts
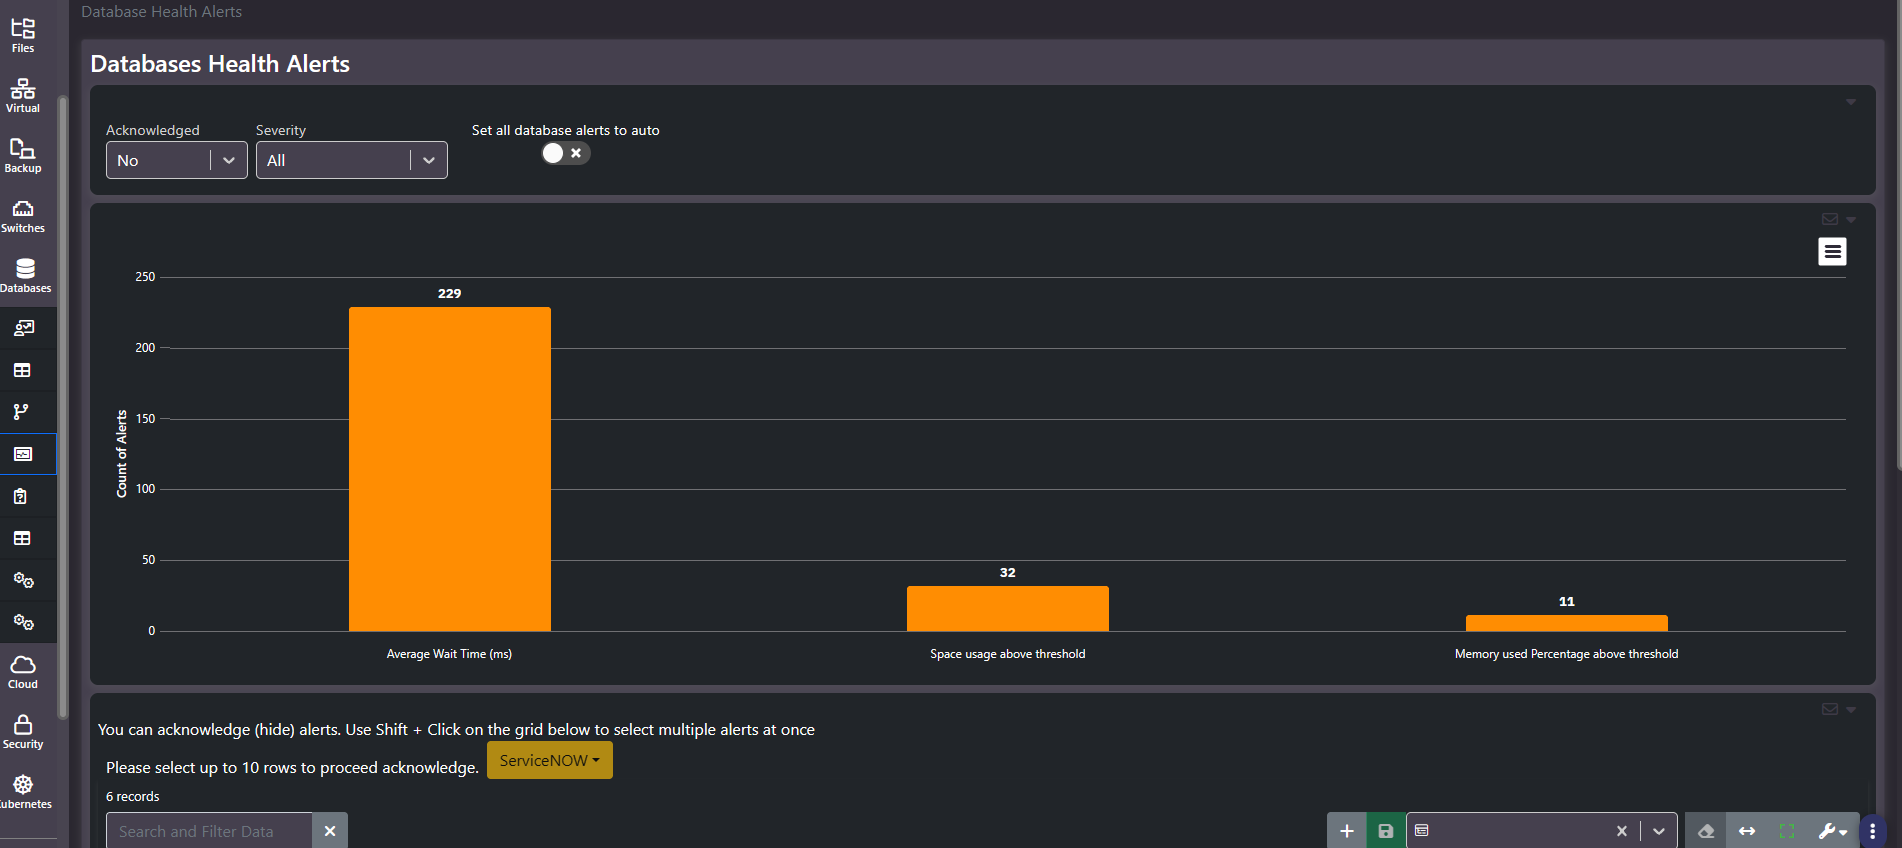
Purpose: The database alert queue. Alert counts grouped by condition over a detail grid, with the same acknowledgment, auto-acknowledge, and ServiceNow escalation model used by the storage, virtual, and cloud alert screens.
When to use it
- Run daily triage on database conditions across every collected instance
- See which condition type dominates the queue before reading individual rows
- Escalate a condition into an incident without retyping its context
- Suppress a class of routine alert using the auto-acknowledge switch
Key areas and metrics
- Acknowledged filter. Defaults to unacknowledged, so you land on open work rather than history.
- Severity filter. Narrows to a severity band.
- Set all database alerts to auto. A toggle that auto-acknowledges database alerts as they arrive.
- Count of Alerts chart. One bar per alert condition, so the composition of the queue is visible before any row is read. Conditions observed include average wait time, space usage above threshold, and memory used percentage above threshold.
- Detail grid. Row selection with a ten-row acknowledgment cap, Shift and click for multi-select, and a ServiceNow menu.
The chart is the triage step
Database alert queues skew heavily. One condition typically accounts for most of the volume while the conditions that actually indicate a problem sit in bars an order of magnitude smaller. Reading the grid first means working through the dominant condition and never reaching the interesting ones.
So read the bars, decide which condition matters, then filter. A large wait-time bar is usually a tuning backlog rather than an outage; a smaller space-usage bar is a capacity problem with a deadline attached and deserves attention first despite the count.
Common actions
- Read the chart before the grid. It tells you which condition to work.
- Treat threshold conditions as capacity work and route them differently from performance conditions, which belong with whoever owns the workload.
- Select up to ten rows and acknowledge once each has genuinely been handled.
- Raise a ServiceNow record for anything needing an owner and a due date rather than an acknowledgment.
Tips
Be cautious with auto-acknowledge. It clears the queue rather than the conditions, and on a database estate the high-volume condition is often the one carrying the tuning backlog you would want to work through eventually.
Acknowledged means handled, not fixed. The threshold is still breached on the instance; you have only removed the row from the working list.
Related screens
Enterprise Databases Summary shows the capacity behind a space-usage alert. Queries Performance and Missing Indexes cover the causes behind wait-time conditions. Cloud Health Alerts uses the same model for cloud.