

Storage by Device Type
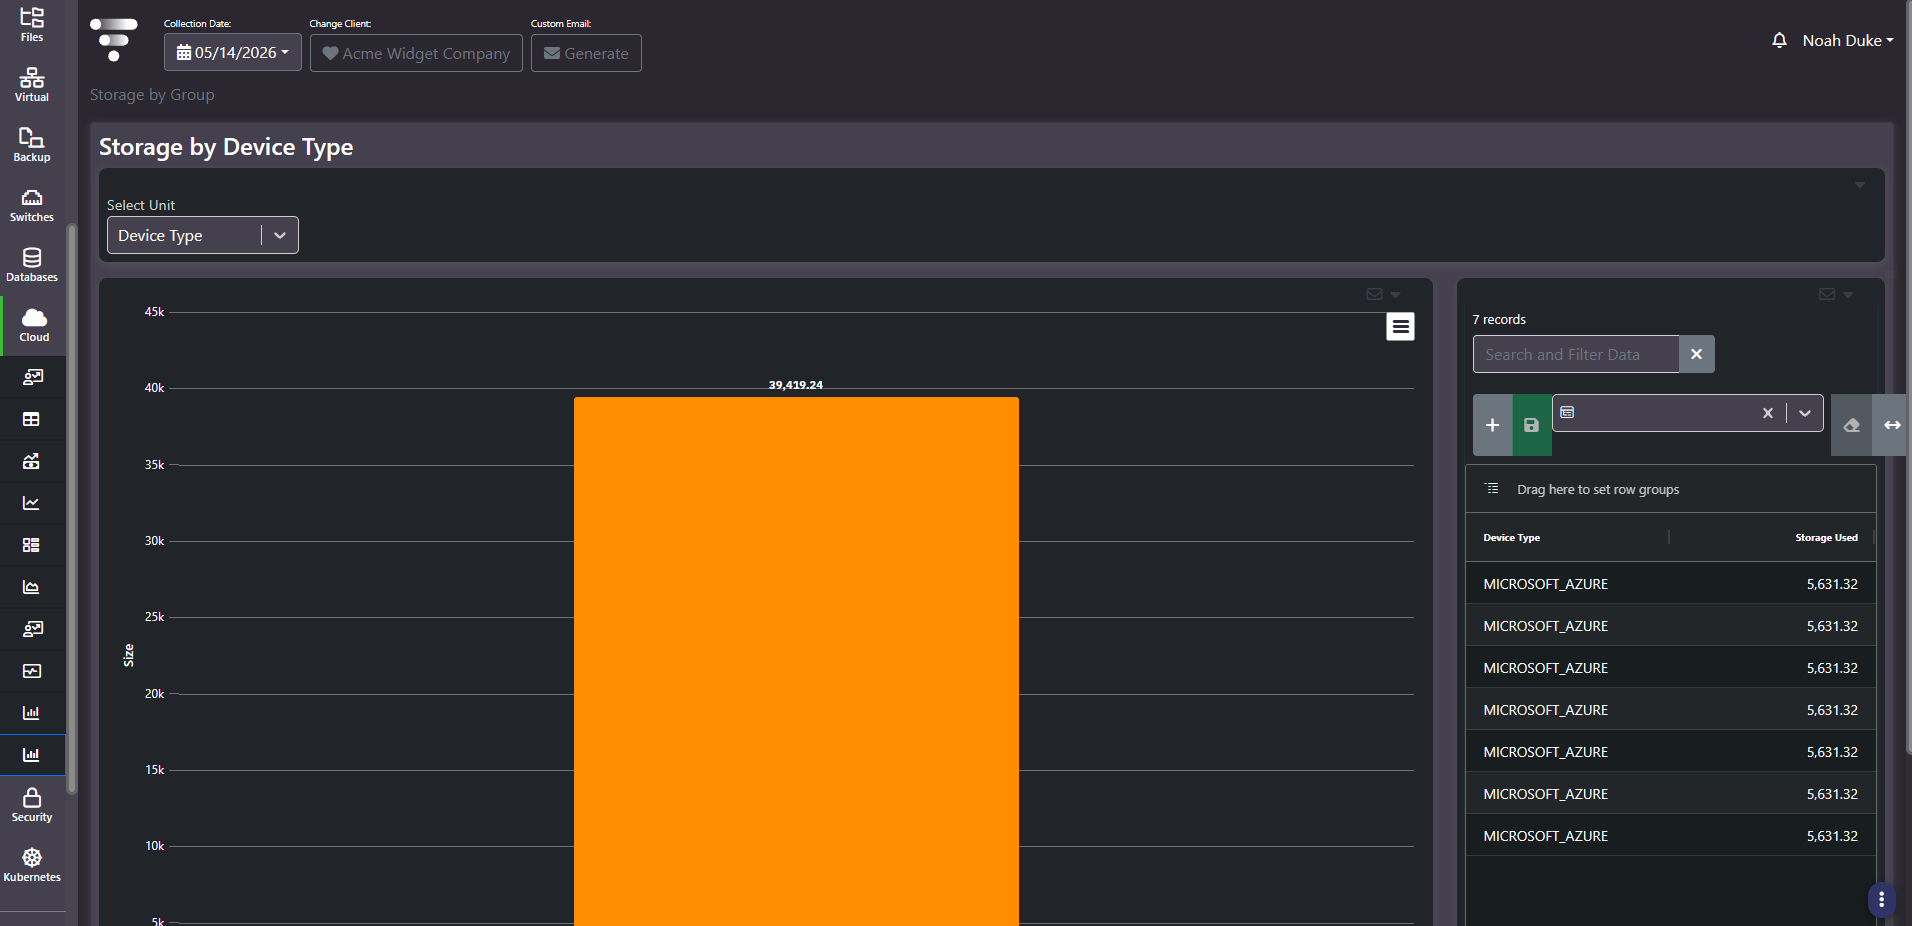
Purpose: Cloud storage consumption split by platform at a point in time. A bar chart with a matching grid, and a unit selector for changing the grouping dimension. It is the cloud counterpart to the on-premises storage grouping reports.
When to use it
- Answer how much cloud storage exists, split by platform
- Confirm which cloud platforms contribute storage at all
- Provide a point-in-time figure to sit alongside the storage trend
- Reconcile cloud storage totals against the on-premises equivalents
Key areas and metrics
- Select Unit. A dropdown choosing the grouping dimension, for example
Device Type. The chart and grid both follow it. - Bar chart. One bar per group, y-axis labelled Size, with the value shown above the bar and an export menu in the panel header.
- Grid. A companion panel to the right of the chart with the same data in rows, carrying the grouping column and Storage Used, plus record count, search and filter, saved column settings, and row grouping.
The chart and grid are two views of one dataset. The bar gives the total for a group; the grid gives the rows that add up to it.
Reading repeated rows
When the grouping dimension is coarser than the underlying data, the grid returns one row per underlying object while showing only the group label. Grouping cloud storage by device type in a single-platform estate therefore produces several rows all reading the same platform name, and the chart bar is their sum rather than the value on any one row.
That is worth knowing before quoting anything from this grid. The figure on an individual row is not the platform total, and adding a finer column through the column chooser, or grouping by subscription instead, will show which object each row belongs to.
Common actions
- Read the chart for the total, not the grid. The bar is the aggregate; the rows are components.
- Change the unit selector to regroup by a dimension that actually distinguishes your objects.
- Pair it with Disk Used Trend. This screen gives today’s split, that one gives the direction of travel.
Tips
A single bar means one cloud platform is collected, not that the chart is broken. Check the subscription list in Cloud All Units if you expected more than one platform to appear.
Related screens
Disk Used Trend is the time-series view of the same measure. Storage by Group and Disk Type by Device are the on-premises equivalents. Cloud Growth Overview attaches cost to the storage.