

Cloud Cost Report
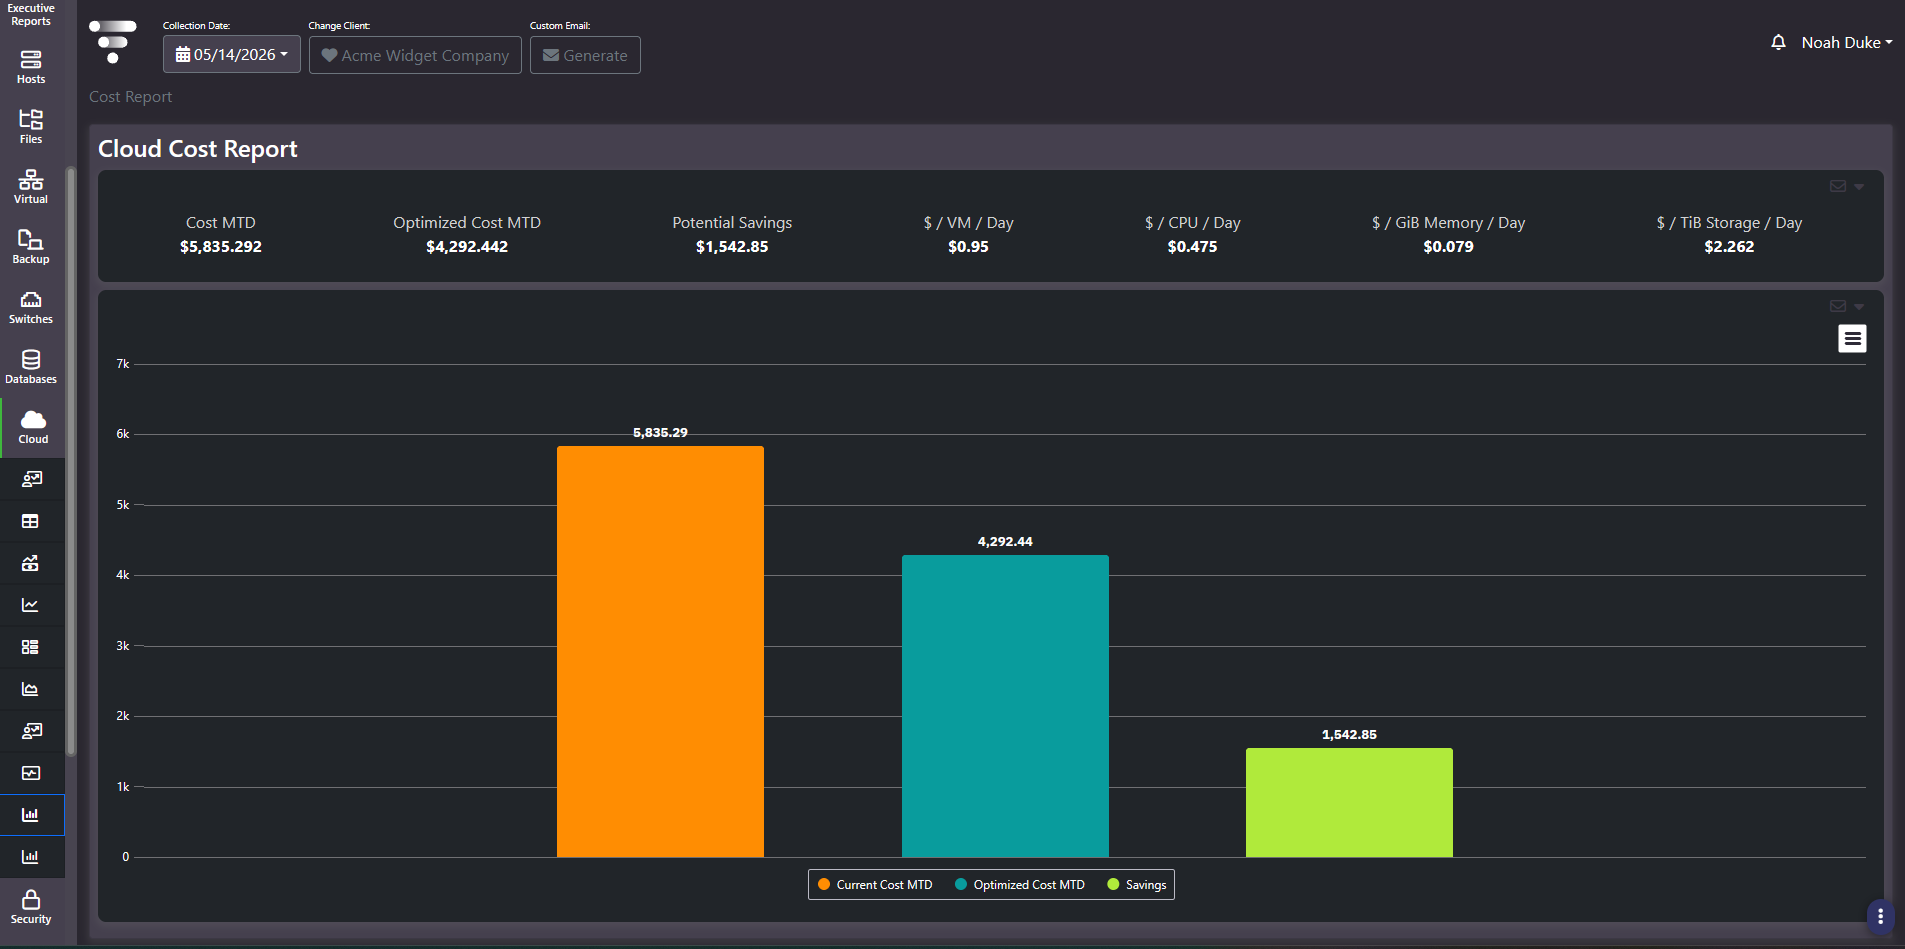
Purpose: Cloud unit economics. Current cost against optimized cost, the savings between them, and four per-unit daily rates. These rates are the numbers that make cloud comparable to on-premises infrastructure, which is why this is the most useful cloud screen in a hybrid cost conversation.
When to use it
- Answer what a VM, a CPU, a GiB of memory, or a TiB of storage costs per day in cloud
- Quantify the gap between what cloud costs and what it would cost optimized
- Provide the cloud side of a cloud-versus-on-premises comparison on a per-unit basis
- Give finance a rate card derived from actual spend rather than list pricing
Key areas and metrics
| Figure | What it means |
|---|---|
| Cost MTD | Actual month-to-date cloud spend |
| Optimized Cost MTD | What the same month would have cost with the identified optimizations applied |
| Potential Savings | The difference between the two |
| $ / VM / Day | Average daily cost of a cloud virtual machine |
| $ / CPU / Day | Average daily cost of a vCPU |
| $ / GiB Memory / Day | Average daily cost of a gibibyte of memory |
| $ / TiB Storage / Day | Average daily cost of a tebibyte of storage |
A bar chart beneath renders the same three cost figures side by side, so the size of the savings opportunity is visible against the spend rather than stated as a number in isolation.
Why the four rates matter
Total cloud spend is not comparable to anything. A per-unit daily rate is, and it is the only form in which a cloud figure can be honestly set against an on-premises one. Visual One derives an equivalent cost per GiB per day for owned storage and per-vCPU and per-GiB-memory rates for owned compute, on the same daily basis, which means these four numbers slot directly into that comparison.
Two cautions. These are averages across the collected estate, so a tenant mixing production and development, or several regions, will produce a blended rate that describes no individual workload precisely. And they are derived from actual spend, which means committed-use discounts and reservations are already reflected. That makes them more useful than list pricing and also means they will move when a commitment is bought or expires.
Common actions
- Take the four rates into a hybrid comparison alongside the equivalent on-premises rates from Financial Administration.
- Track Potential Savings month over month. A figure that does not move means recommendations are being surfaced and not adopted.
- Use $ / VM / Day for migration sizing. Multiplied by VM count it gives a defensible first-pass estimate of moving a workload to cloud.
- Note the collection date when quoting any of these, since they are month-to-date and shift through the month.
Tips
Optimized Cost MTD is a modelled figure, not an achieved one. It states what the month would have cost had the optimizations been in place, which is the right number for sizing an opportunity and the wrong number to report as a saving.
Related screens
Financial Administration holds the equivalent on-premises per-unit rates. Optimization Recommendations lists the specific actions behind the potential savings. Cloud Resource Group Modeling applies these rates to a workload that does not exist yet.