

Cloud Growth Overview
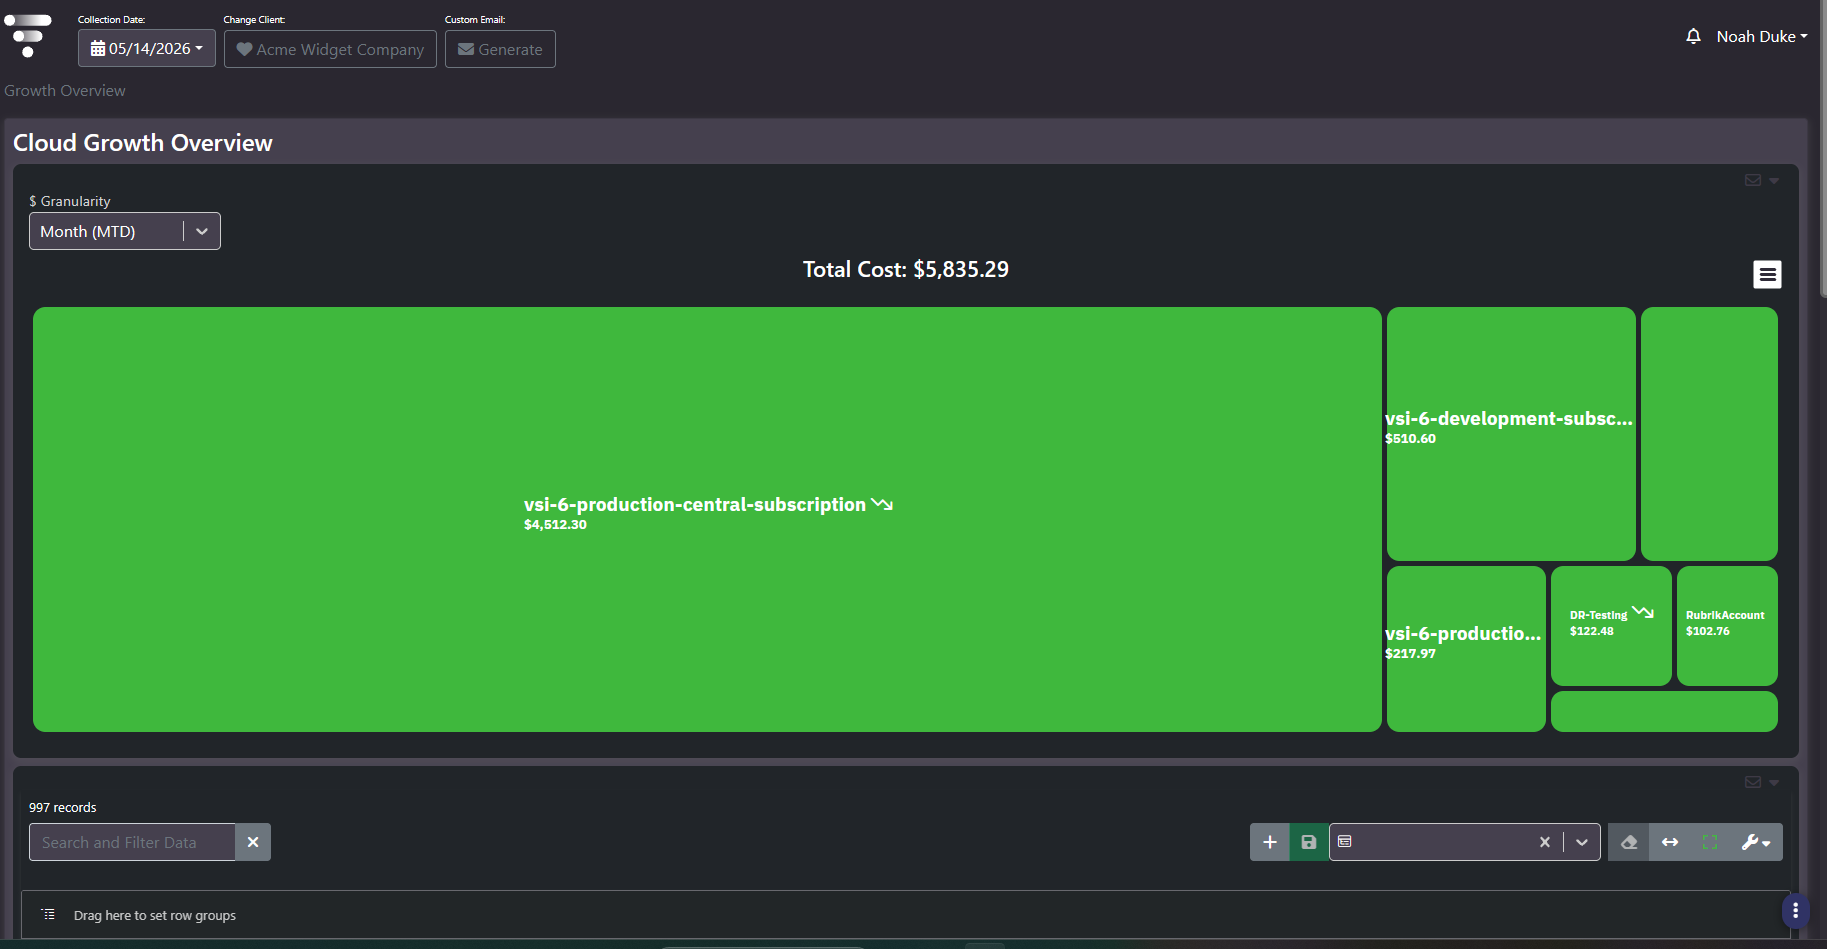
Purpose: Where cloud cost sits and which parts of it are moving. A treemap sized by spend per subscription over a resource-level grid carrying daily, month-to-date, and year-to-date cost with a thirty-day growth figure per resource.
When to use it
- See at a glance which subscription dominates spend
- Find the individual resources driving growth rather than the ones that are merely large
- Break spend down by service, resource type, or geography
- Spot resources that are provisioned and failing, which cost money and deliver nothing
Key areas and metrics
- $ Granularity. Sets the period every figure covers, commonly
Month (MTD). - Total Cost. Stated above the treemap, so the tiles have a denominator.
- Treemap. One tile per subscription, area proportional to cost, each tile labelled with its own figure and carrying a trend arrow showing direction against the prior period.
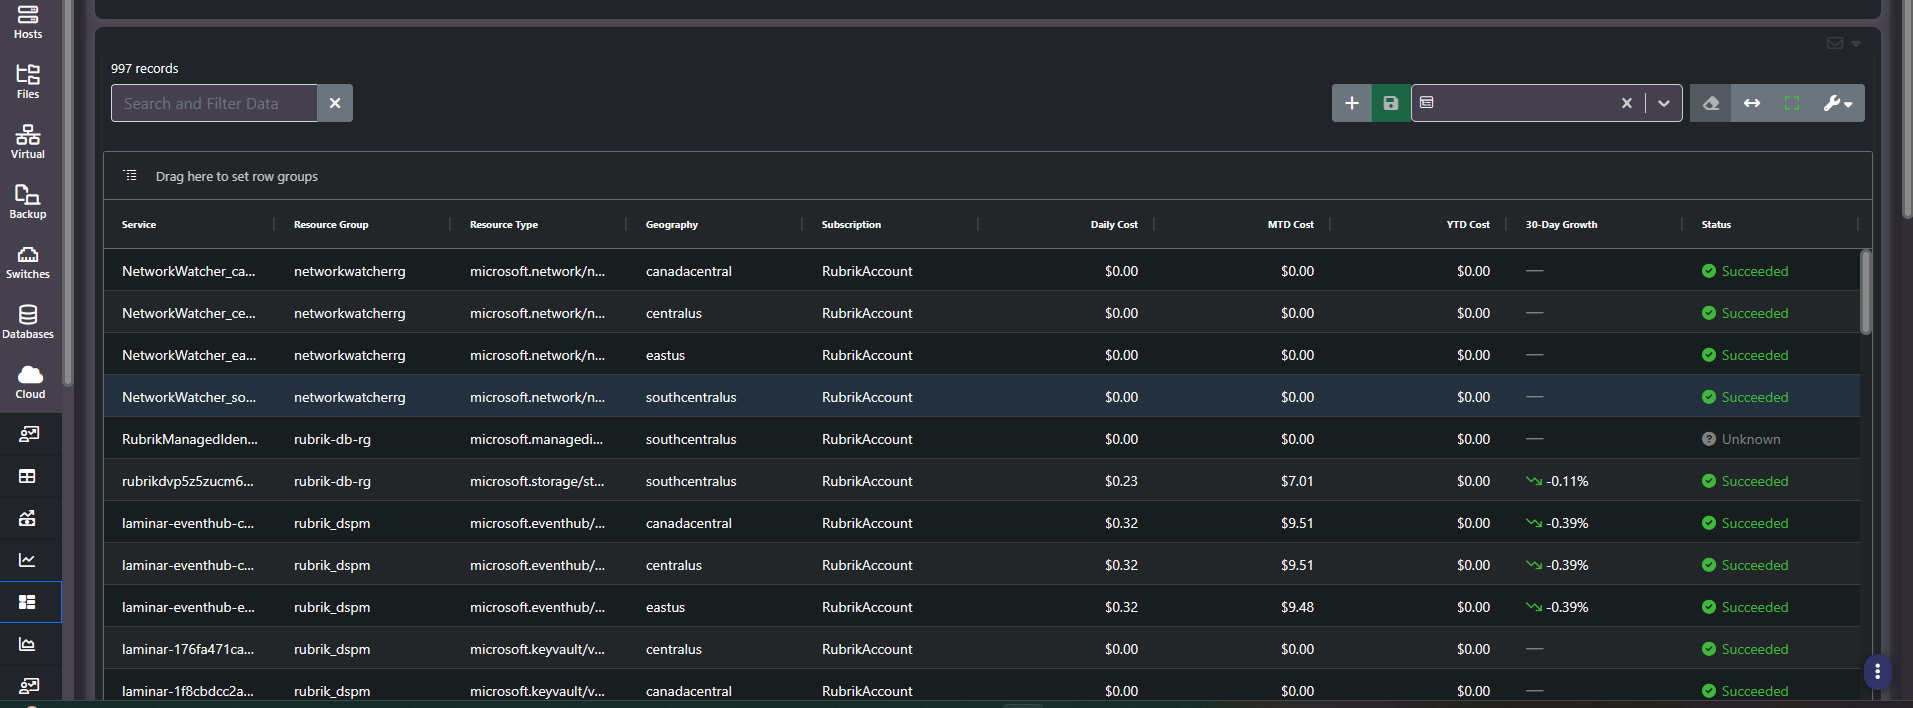
- Resource grid. The detail behind the tiles, typically running to hundreds or thousands of rows.
| Column group | Columns |
|---|---|
| Identity | Service, Resource Group, Resource Type, Geography, Subscription |
| Cost | Daily Cost, MTD Cost, YTD Cost |
| Movement | 30-Day Growth, shown as a directional arrow with a percentage, or a dash where there is no comparison period |
| State | Status, for example succeeded or unknown |
Size and growth are different questions
The treemap answers which subscriptions are big. The 30-Day Growth column answers which resources are changing. Those rarely point at the same thing, and growth is the more actionable of the two: a large stable subscription is a known cost, while a small resource growing steeply is next quarter’s problem and is far cheaper to address now.
The Status column is worth a pass of its own. A resource with a non-succeeded status and a non-zero daily cost is being billed for something that is not working, and those are easy to leave in place for months because nothing else surfaces them.
Common actions
- Sort by 30-Day Growth descending to get the movers, then filter to non-zero cost so you are not reading noise.
- Group by Geography to expose spend in regions nobody intended to deploy into, which is a common finding in a multi-team tenant.
- Group by Resource Type to see which service families dominate, which is the input to a commitment or reservation conversation.
- Filter Status to anything other than succeeded and check the cost columns beside it.
Tips
A YTD Cost column reading zero across every row while MTD carries figures means the year-to-date aggregation has not populated. Use MTD for anything you intend to report until that is resolved.
Related screens
Cloud All Units is the subscription-level inventory behind the treemap. Cloud Resource Group Forecast projects a single resource group forward. Disk Used Trend covers the storage dimension of the same growth.