

Cloud Summary
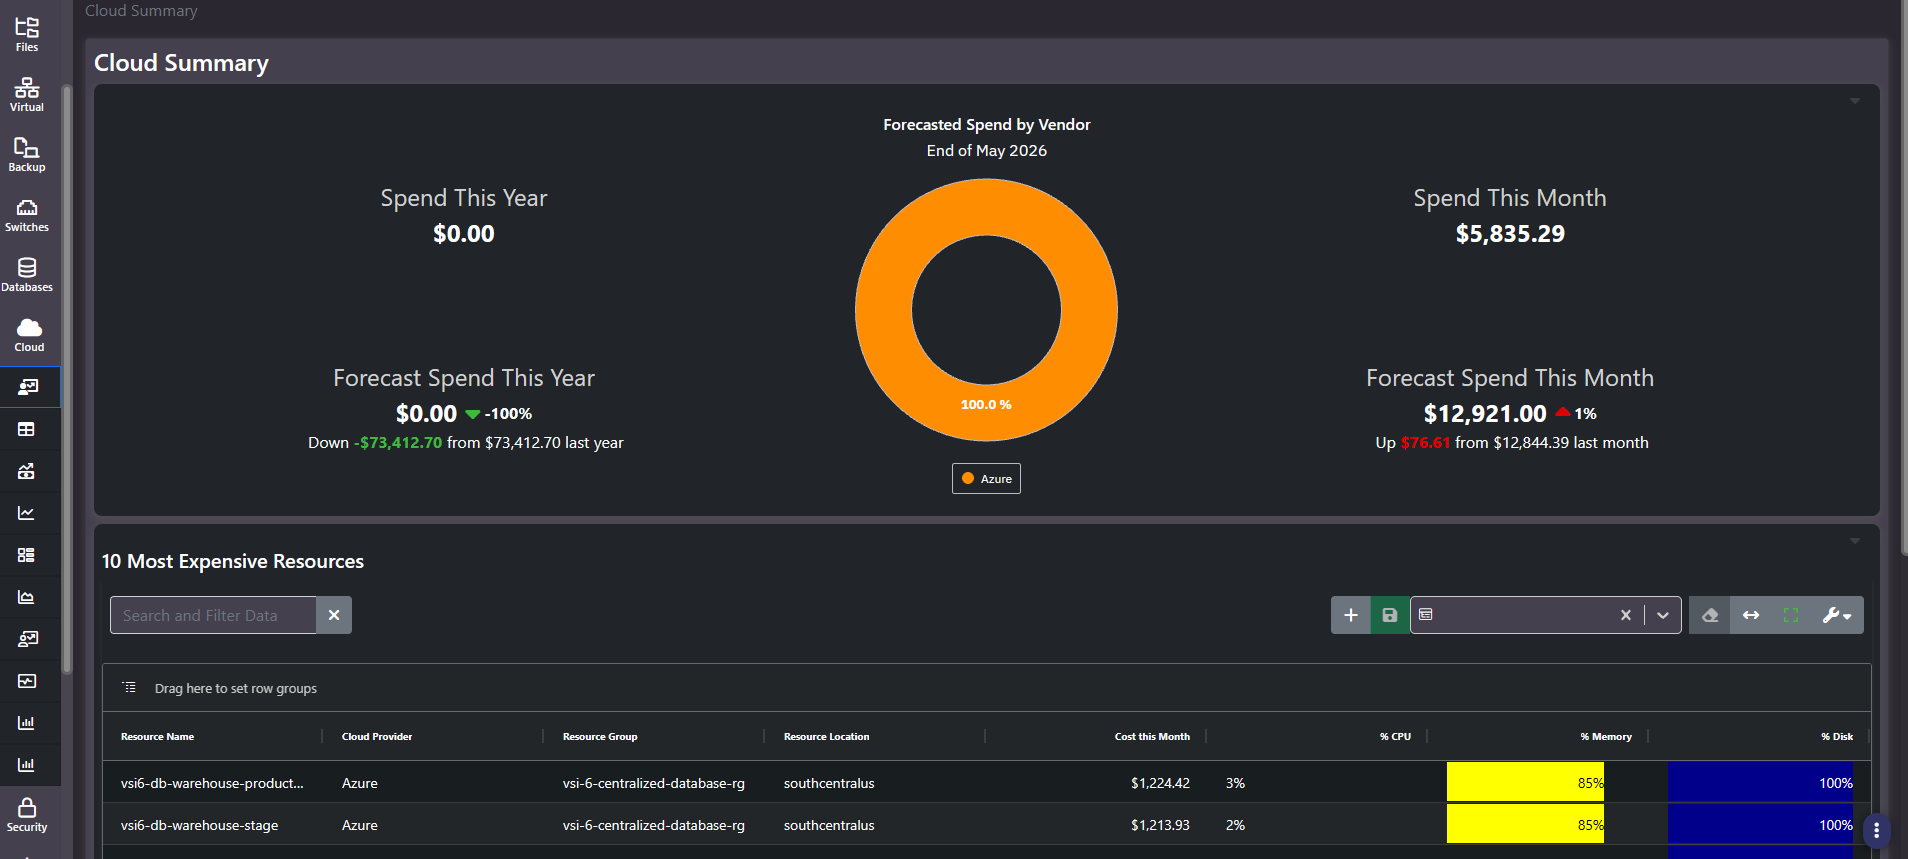
Purpose: The cloud position on one screen. Four spend figures with a vendor split, over a ranked list of the resources costing the most. It is the landing screen for the section and the fastest read on whether cloud spend is where it should be.
When to use it
- Answer what cloud is costing this month and where it lands by month end
- See whether spend is rising or falling against the equivalent prior period
- Identify the handful of resources responsible for most of the bill
- Confirm which cloud vendors are actually being collected
Key areas and metrics
| Figure | What it carries |
|---|---|
| Spend This Year | Actual year-to-date spend |
| Forecast Spend This Year | Projected full-year spend, with a percentage change and an absolute comparison against last year |
| Spend This Month | Actual month-to-date spend |
| Forecast Spend This Month | Projected month-end spend, with percentage change and absolute comparison against last month |
| Forecasted Spend by Vendor | A donut splitting the forecast across cloud providers, with the horizon stated above it |
The comparison lines beneath the forecasts are the useful part. Each states the direction, the percentage, and the absolute figure it is measured against, so the number arrives with its own context rather than needing a second screen to interpret.
10 Most Expensive Resources
A grid ranking the top cost contributors, with columns for Resource Name, Cloud Provider, Resource Group, Resource Location, Cost this Month, and utilization percentages for CPU, memory, and disk. The utilization cells are shaded by severity.
Cost next to utilization on the same row is what makes this more than a spend list. An expensive resource running at high memory and disk utilization is earning its cost. An expensive resource with single-digit CPU and high disk is a right-sizing candidate, and the shading makes that pattern visible without reading the numbers.
Common actions
- Read the month forecast against last month first. It is the earliest signal that something changed, and the percentage is small enough to be trustworthy when the absolute figure is stated beside it.
- Scan the grid for low CPU against high cost. That combination is the shortest route to a saving.
- Check the vendor donut for single-vendor concentration where you expect several. It usually means a collector is missing rather than a genuine single-cloud estate.
Tips
If Spend This Year reads zero while Spend This Month carries a figure, the year-to-date aggregation has not populated rather than the spend genuinely being zero. Verify against the Growth Overview grid before reporting an annual number from this screen.
Related screens
Cloud Cost Report converts these totals into unit rates. Cloud Growth Overview shows which subscriptions the spend sits in. Optimization Recommendations turns an expensive underused resource into a specific action.