

Tag Cost Inventory
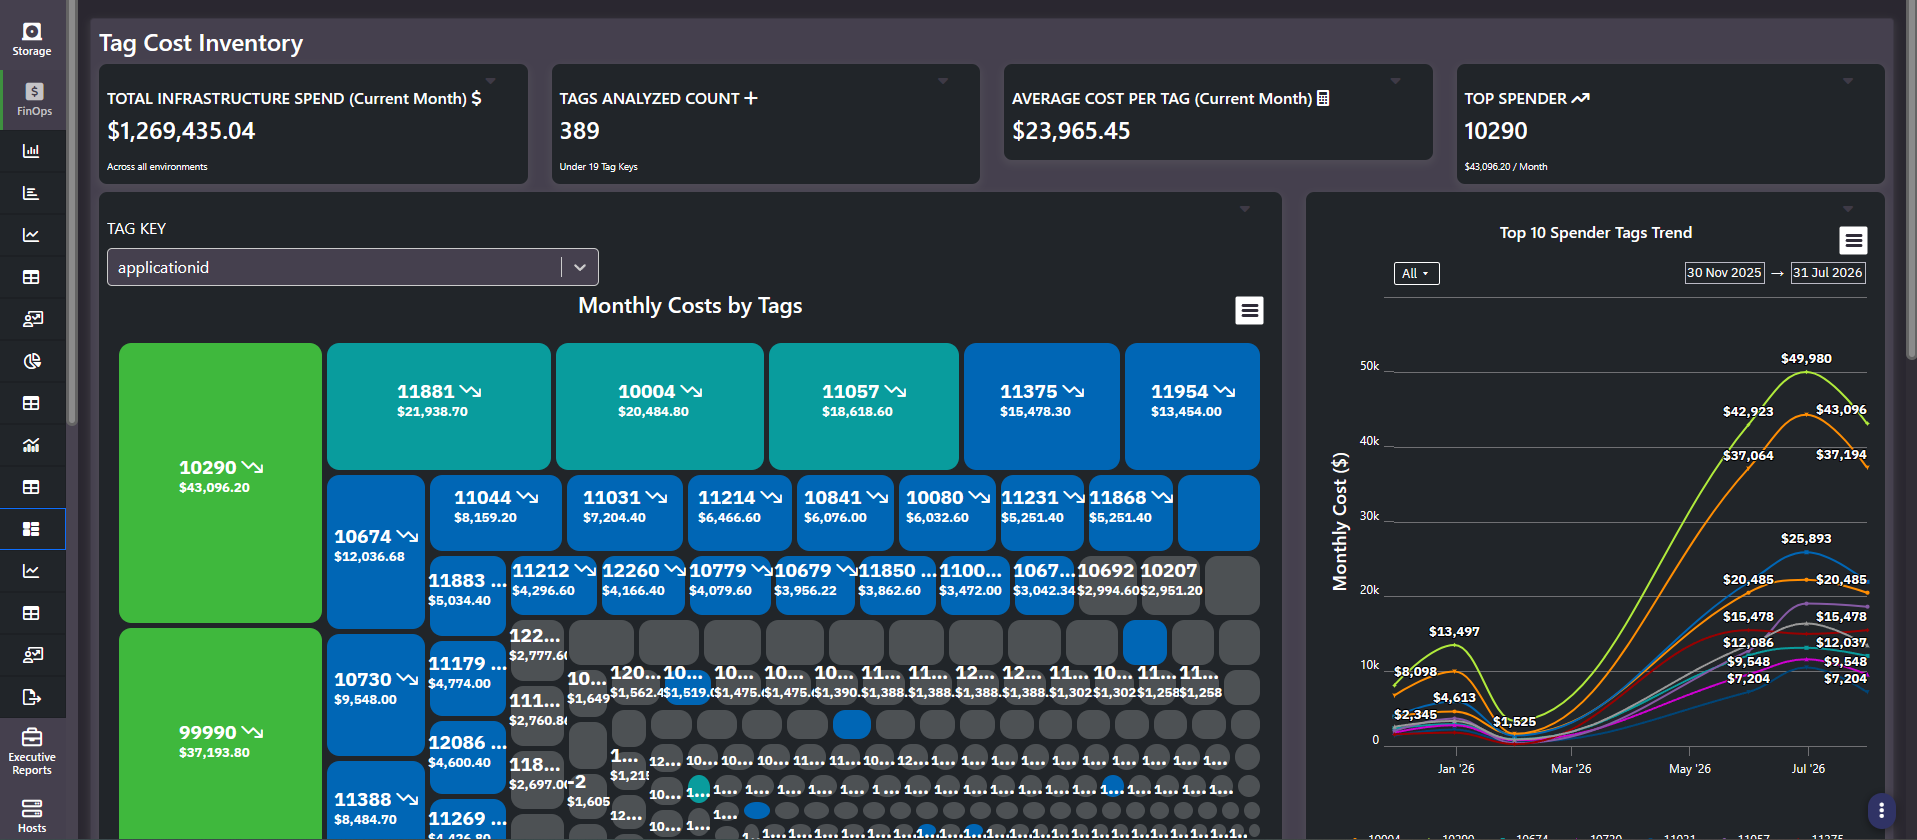
Tag Cost Inventory is the entry point for cost-by-tag. It ranks the current month’s spend by tag value, shows how the top spenders are trending, and sits on top of a full inventory of what the environment actually contains.
What this screen shows
Four KPI tiles across the top set the scene: total infrastructure spend for the current month, how many tags were analyzed and under how many keys, average cost per tag, and the current top spender with its monthly figure.
- Monthly Costs by Tags. A treemap where tile area is proportional to spend, filtered by a Tag Key dropdown. Each tile carries a trend arrow indicating movement against the prior period, so you can see size and direction at once.
- Top 10 Spender Tags Trend. A multi-line chart, one series per tag value, with a series filter, date range pickers, zoom presets, and a Save control.
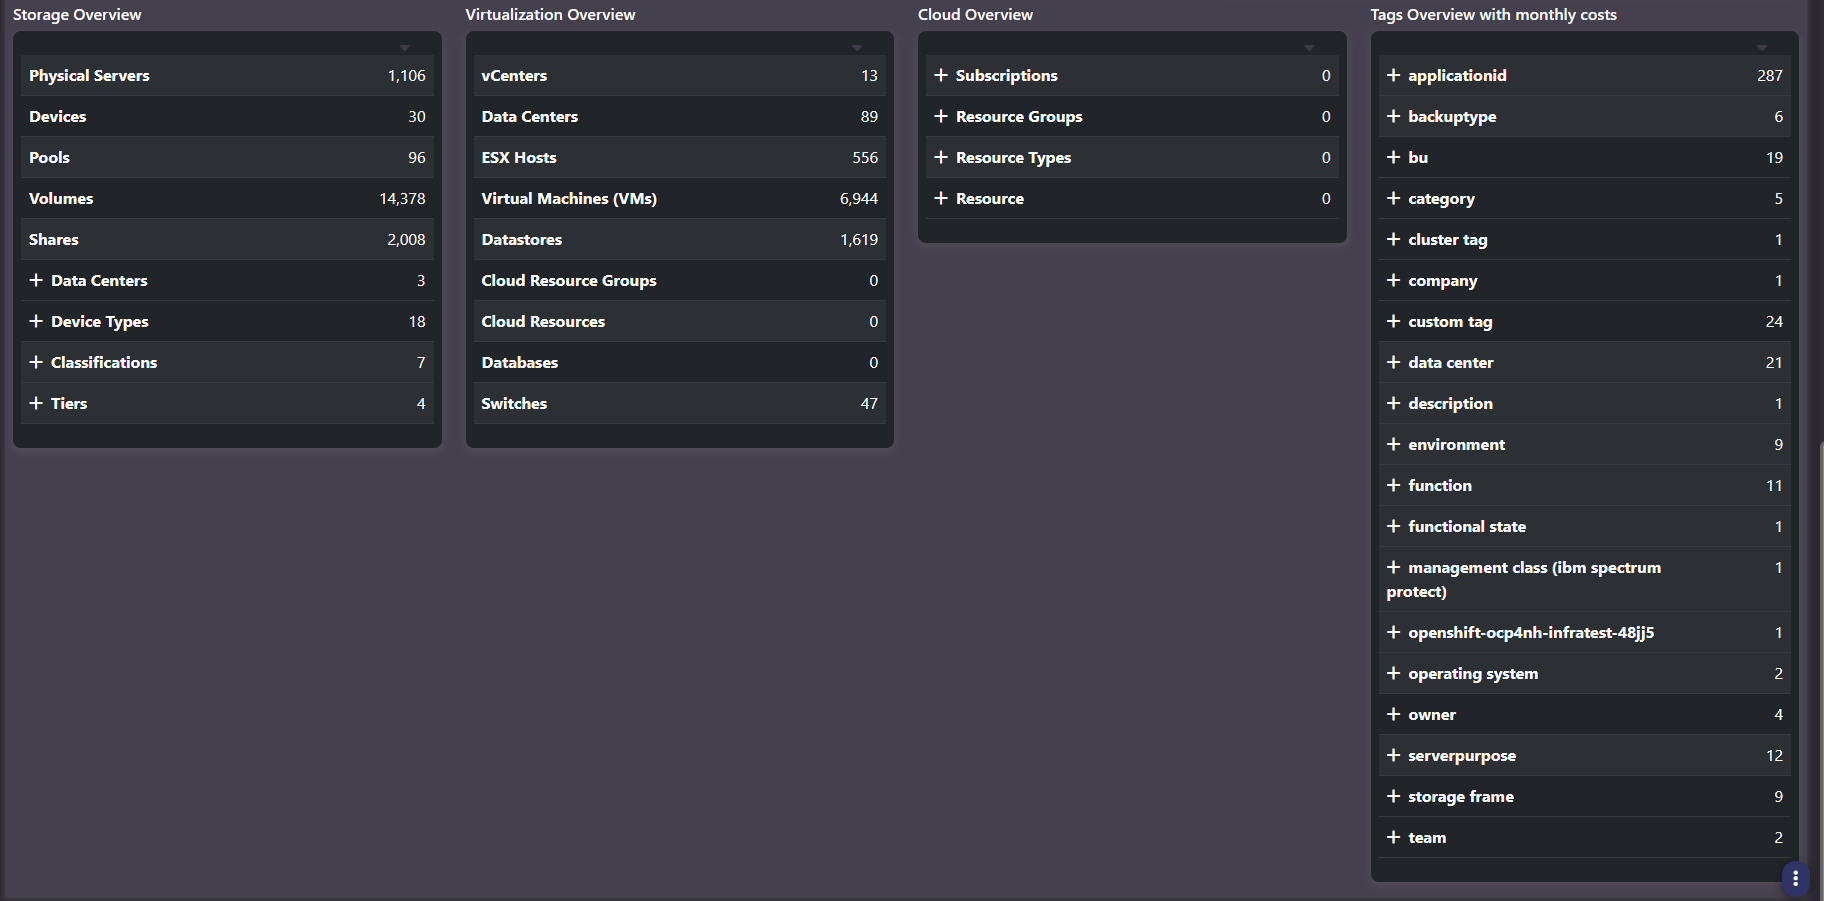
- Inventory panels. Expandable summaries of the storage, virtualization, and cloud estate, plus a tag overview listing every tag key with its value count.
The Tag Key filter changes the question
Switching the Tag Key dropdown re-renders both the treemap and the trend chart against the new dimension. That is not a cosmetic change, it is a different question.
| Group by | The question it answers |
|---|---|
| Business unit | Which part of the organization consumes the most infrastructure |
| Owner | Which individuals or teams have the most spend attached to their name |
| Operational category | How much goes to production versus development, test, and backup |
| Environment or cost center | Whatever governance dimension your organization actually manages by |
Why the inventory panels are here
The counts underneath, physical servers, devices, pools, volumes, shares, vCenters, ESX hosts, VMs, datastores, subscriptions, resource groups, resource types, are context for the cost figures above them. They also expose tag coverage: the tag overview panel lists every key with the number of distinct values behind it, which is the fastest way to spot a governance tag applied to almost nothing.
Tip: Read the treemap and the trend chart together. A large tile that is trending down is a success story. A small tile trending sharply up is next quarter’s large tile, and it is much cheaper to address now.
What each audience takes from it
- The practitioner uses it to find where spend concentrates, which is where optimization effort earns the most.
- Finance uses it to verify that allocation is complete. A large unallocated or thinly tagged share means the chargeback report downstream cannot be trusted yet.
- Product uses it to see what a service actually consumes, which is the input to pricing it.
Same costs, different lens. Switching the tag key is what changes which of those three questions the screen is answering.
Related screens
Click into a tag and Tag Summary lists the resources behind it. Tag Forecasting projects it forward. All Tags is the underlying catalog.