

Tag Summary
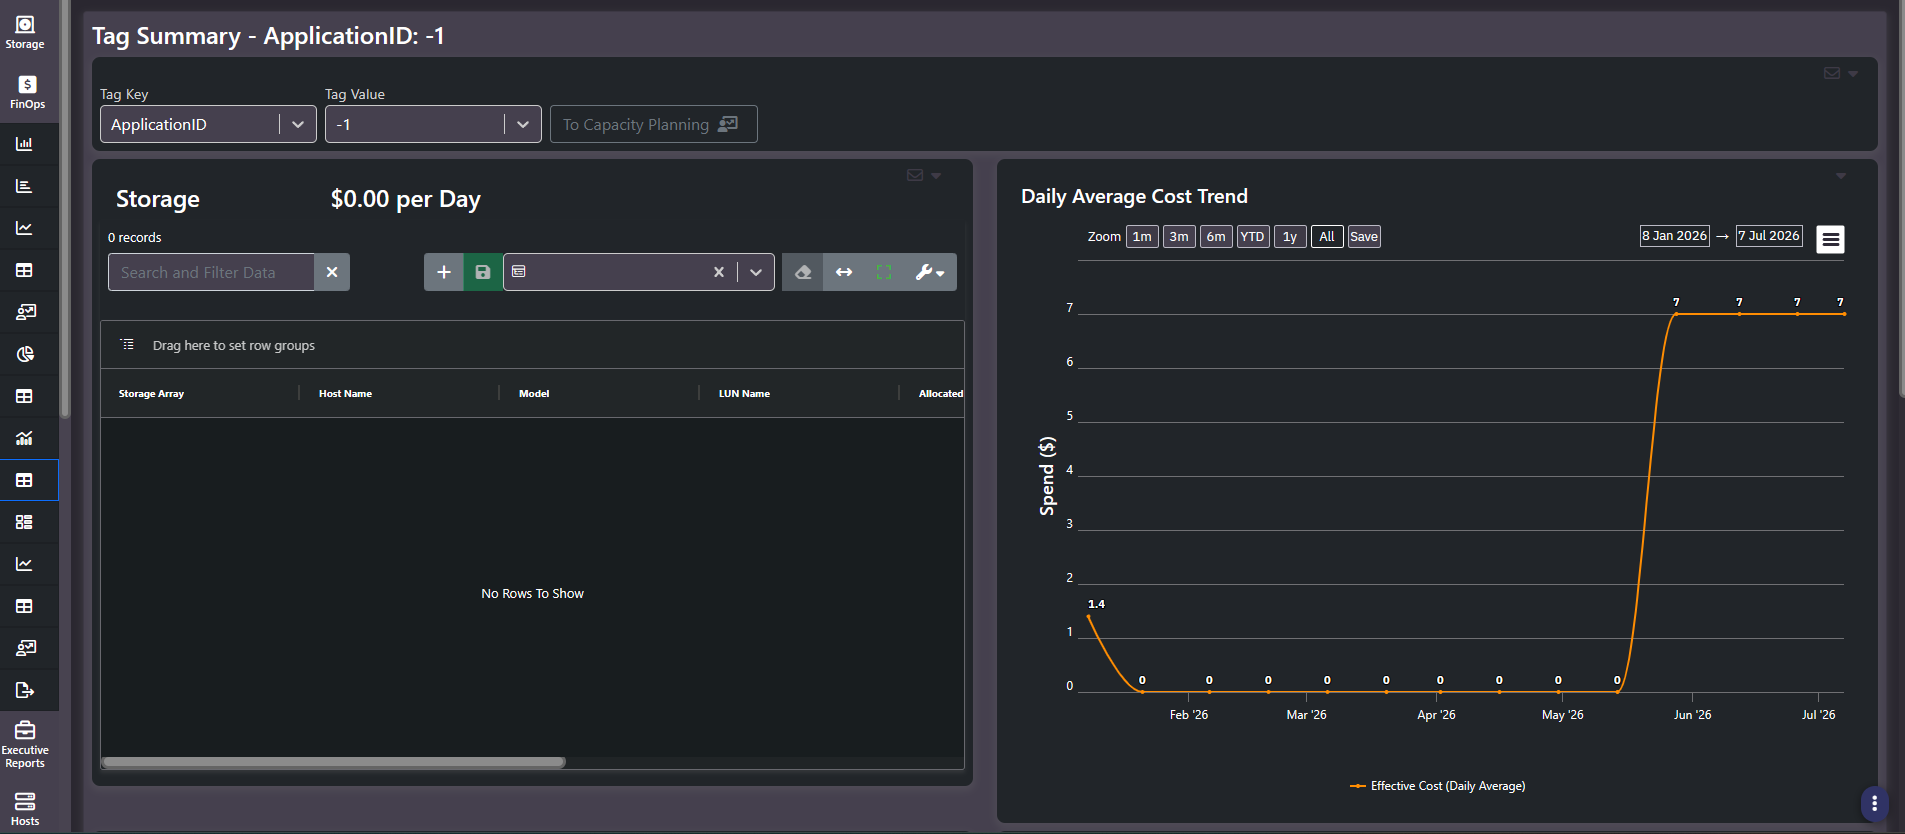
Tag Summary answers a question a business unit lead will eventually ask: what exactly am I being charged for. Pick a tag key and value, and the screen lists every storage, cloud, and virtual resource carrying it, each with its own daily cost, plus the combined spend trend for that tag.
What this screen shows
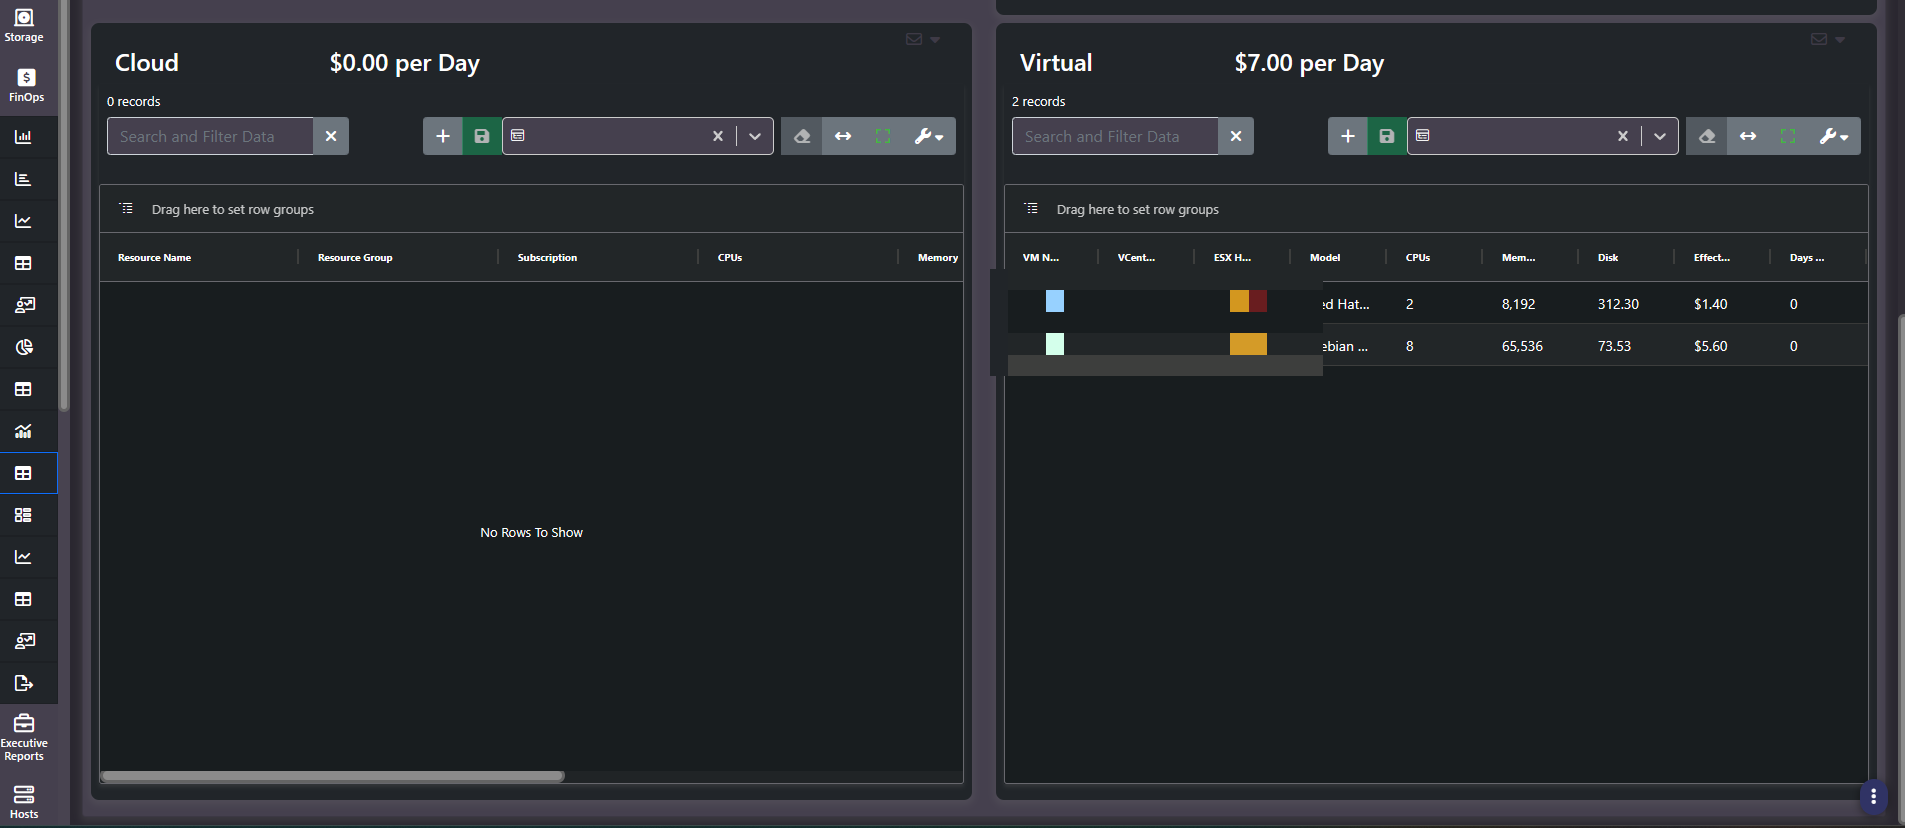
Two dropdowns at the top, Tag Key and Tag Value, drive four panels at once. The page title reflects the current selection, so a shared screenshot is self-documenting. Three of the panels are resource grids, one per infrastructure type, each with its own daily cost subtotal and record count in the panel header. The fourth is a daily average cost trend chart for the tag as a whole.
| Panel | Columns |
|---|---|
| Storage | Storage Array, Host Name, Model, LUN Name, Allocated (GiB), Used (GiB), Effective Cost (Daily Average) |
| Cloud | Resource Name, Resource Group, Subscription, CPUs, Memory, Disk, Actual Cost (Daily), Days Old, Count |
| Virtual | VM Name, vCenter Name, Model, ESX Host Name, CPUs, Memory, Disk, Effective Cost (Daily Average), Days Old, Count |
The three subtotals side by side are the useful part. A business unit that assumes it is a cloud consumer often turns out to carry most of its cost on-prem, and this is the screen where that becomes undeniable.
The trend chart
A single series showing effective cost per day for the selected tag over the chosen window, with zoom presets, explicit date pickers, and a Save control. Use it to distinguish a tag that is genuinely growing from one that jumped once when a workload was onboarded.
Getting here and moving on
- Arriving. Either select the key and value directly, or double-click a row in the tag catalog, which lands you here pre-filtered.
- Leaving. A To Capacity Planning button in the header carries the current tag context straight into forecasting, so you do not have to reselect it.
Note: An empty panel is a real answer, not a failure. A tag with no virtual resources shows an empty Virtual grid and a zero subtotal rather than an error, and that tells you something about how the tag is being applied.
Three cost bases in one view
The three panels do not all report the same kind of number, and the distinction matters when you quote a figure from this screen.
| Panel | Cost basis | What it means |
|---|---|---|
| Storage | Effective cost, daily average | Derived from the operating cost model, since the array issues no invoice |
| Virtual | Effective cost, daily average, at the VM level | Derived the same way, allocated from the host down to the virtual machine |
| Cloud | Actual cost, daily | What the provider actually billed for that resource |
Effective cost is modeled from acquisition and operating inputs. Actual cost is reported by the provider. Visual One sums them and trends the combined figure so a single tag has one daily cost story, but if someone challenges a number, knowing which of the two bases it came from is the first thing to establish.
Related screens
All Tags is the catalog you drill in from. Tag Forecasting is where the To Capacity Planning button leads. Tag Cost Inventory ranks this tag against every other one.