

All Tags Report
The All Tags Report is the catalog. Every distinct tag key and value discovered anywhere in the environment, on one grid, with no charts and no dollar figures. It exists so you can see what your tagging actually looks like before you trust any report that groups cost by tag.
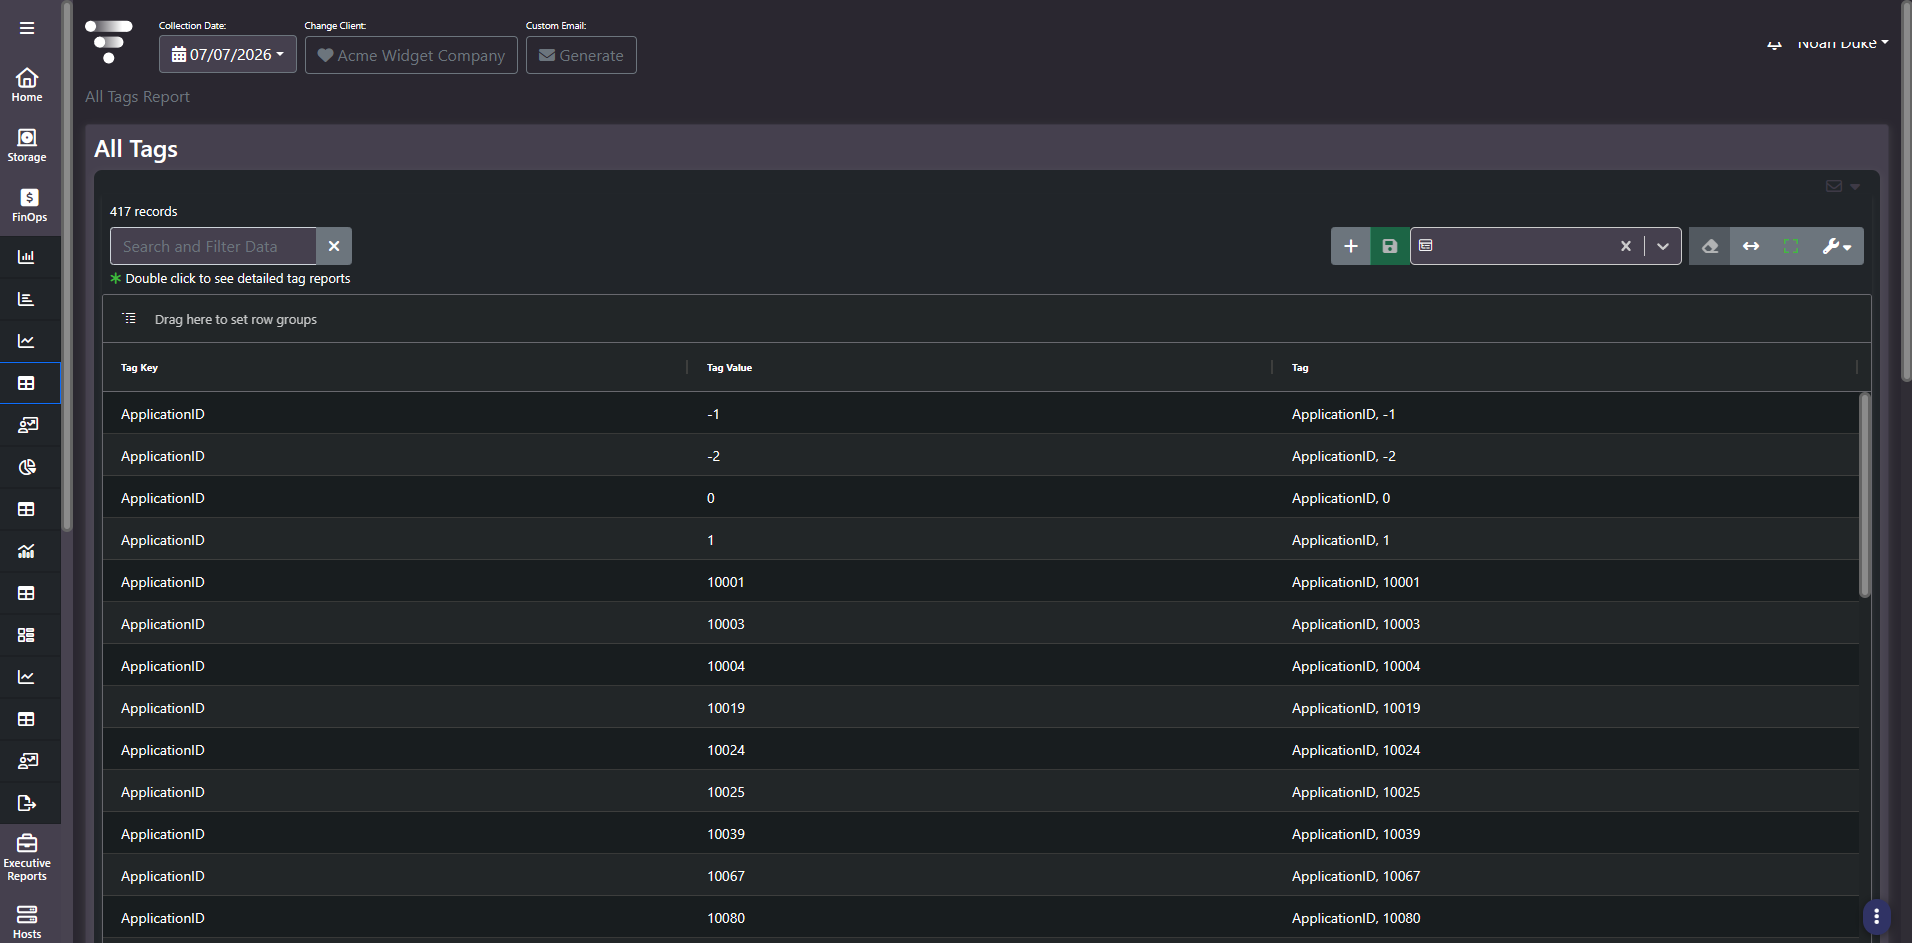
What this screen shows
A single grid with three columns: Tag Key, Tag Value, and a concatenated Tag column combining the two. Helper text above the grid reads Double click to see detailed tag reports, and double-clicking a row drills through to the tag detail view pre-filtered to that key and value.
The content spans everything the collectors found: your deliberate governance tags such as business unit, owner, environment, cost center, and operational category, alongside machine-generated tags written by cloud platforms and backup tooling. Both kinds appear, because both are real and both affect how cost groups.
What to look for
- Near-duplicate values.
Devanddevelopmentunder the same key are two buckets in every cost report until somebody standardizes them. - Case and spacing drift. The same value entered three ways splits one business unit’s cost three ways.
- Tag pollution. Keys carrying dozens of machine-generated hash or timestamp values add cardinality without adding meaning. Know which keys those are so you do not group by them.
- Missing coverage. A governance tag that exists but carries few values usually means it was defined and never applied.
Tip: Work this screen before you circulate a chargeback report. Every cleanup here shrinks the unallocated bucket downstream, and it is far cheaper to fix a tag than to explain a wrong invoice.
How it connects the tag screens
This report is the navigation hub for the rest of the tag tooling. The catalog tells you a key and value exist. Double-clicking takes you to the resources and cost behind it. From there you can follow the same tag into trending and forecasting without re-selecting it.
This is the catalog after normalization
Tags do not arrive clean. Cloud resources carry native tags applied inconsistently, virtual compute carries some, and storage arrays carry none because the platform has no tagging concept. Visual One adds a normalization layer under Settings that reconciles those variants before they reach any cost report.
- Key and value unification. Several variants of the same key or value, including ones that arrive URL encoded, resolve to a single entry. The mapping works on keys and on values.
- Machine-generated key consolidation. Platforms such as Kubernetes auto-generate numerous distinct keys for what is conceptually one dimension. Those collapse into a single key, so no engineering team has to tag a cluster a particular way for the reporting to work.
- Cross-source resolution. One business unit resolves consistently across a cloud subscription and an on-premise cluster, which is the whole point. Without it, finance gets several partial answers instead of one.
So the entries you see here are the resolved catalog, and each one is a navigation point into cost detail. When finance asks who owns a line item, the path from this screen to the answer is short. Raw, unresolved tag objects are visible on the FOCUS Export screen if you need to debug what a source actually sent.
Related screens
Tag Summary is the drill-through destination: every resource carrying one tag value, with daily cost. Tag Cost Inventory ranks tags by spend. Chargeback Report is what tag quality ultimately determines.