

Chargeback Report
The Chargeback Report is where infrastructure cost becomes somebody’s line item. It maps every costed resource to the organizational tags it carries, then rolls those into per-tag totals you can bill against or publish as showback.
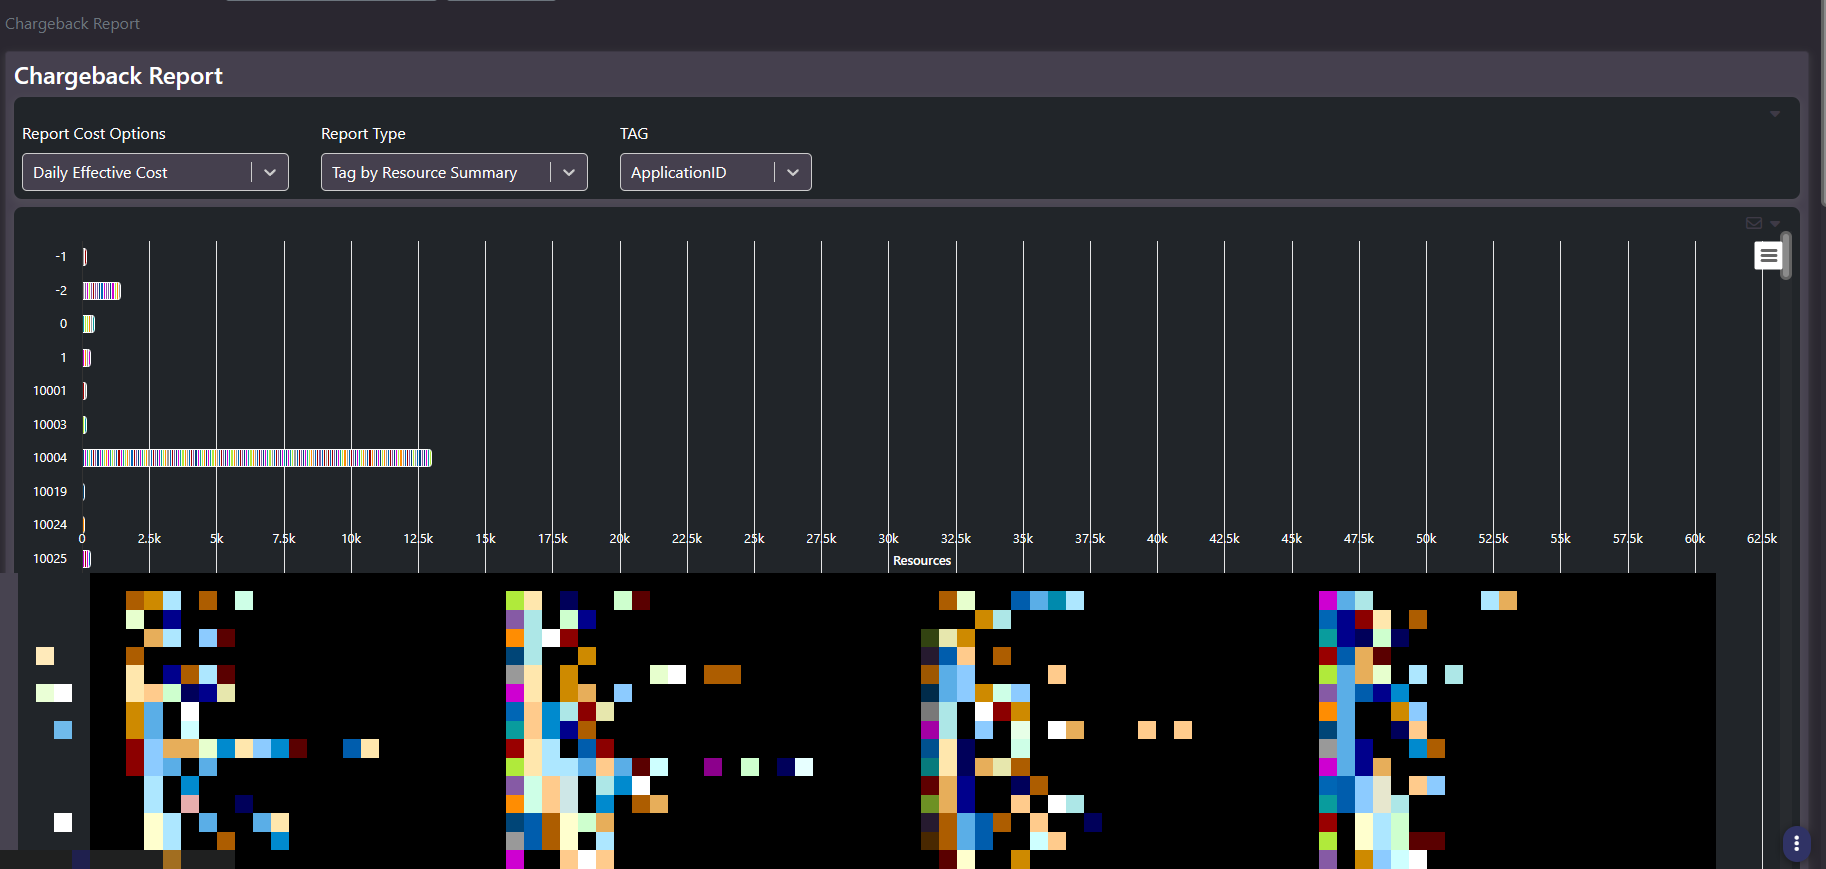
What this screen shows
Three header controls drive the whole page.
| Control | Options | What it changes |
|---|---|---|
| Report Cost Options | Daily Effective Cost, Monthly Effective Cost, YTD Effective Cost | The period every cost figure covers |
| Report Type | Tag by Resource Summary, Resource Summary by Tag | Which side of the relationship leads the summary |
| Tag key selector | Any tag key in the environment, for example business unit, owner, or operational category | The dimension the chart and grid group by |
Below the controls sits a horizontal stacked bar per tag value, segmented into one block per underlying resource. The legend renders below the chart rather than inside it, because the number of distinct resources is high enough that an in-chart legend would be unreadable.
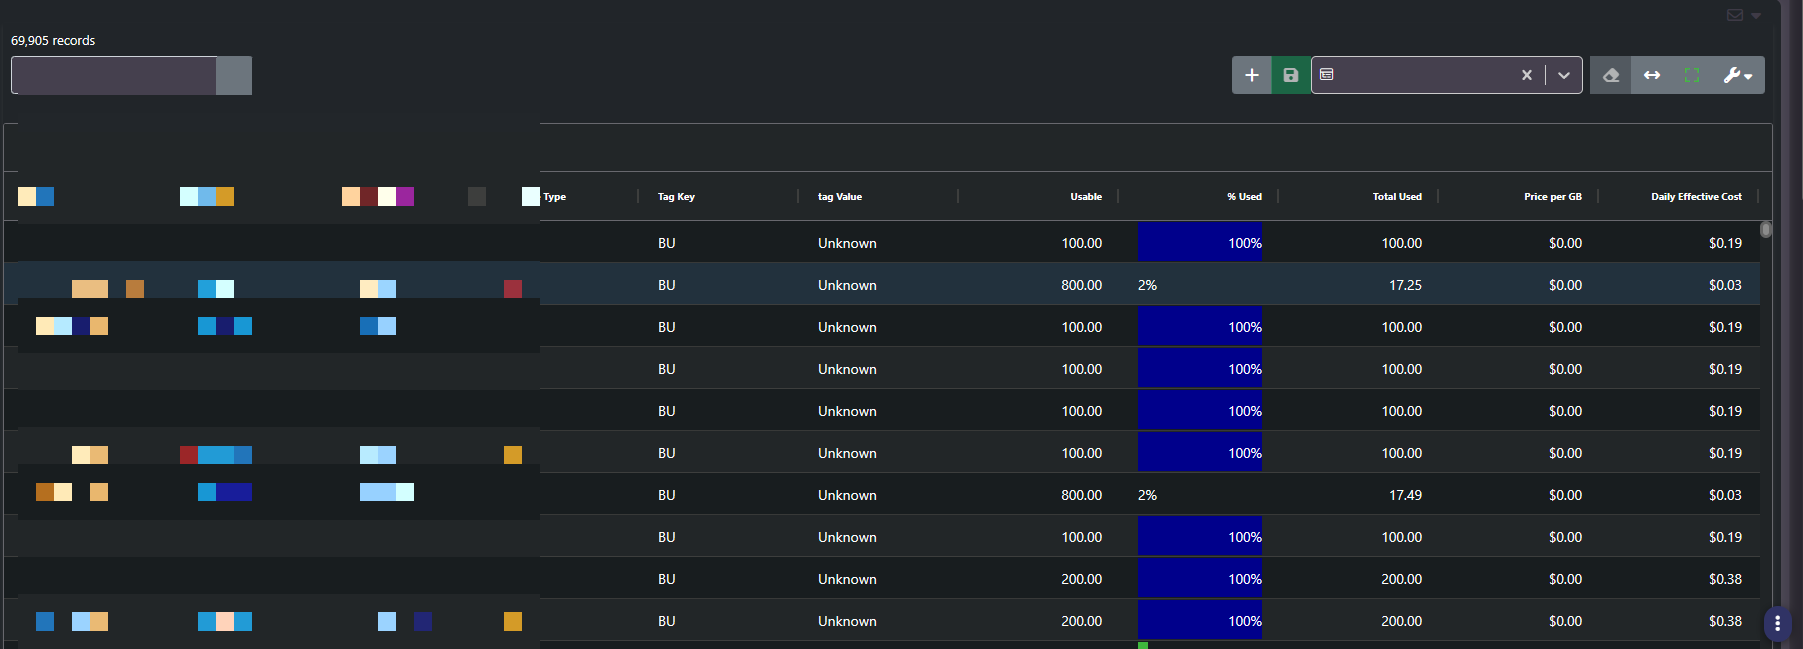
The detail grid
Columns are Array, Device Type, Resource Name, Resource Type, Tag Key, Tag Value, Usable, % Used (rendered as an inline bar), Total Used, Price per GB, and Daily Effective Cost. This is the most granular per-resource cost breakdown in the product.
Important: A resource appears once per tag key it carries. A single VM tagged with business unit, owner, and operational category produces three rows. Record count therefore runs well ahead of resource count, and summing the cost column across the unfiltered grid will overcount. Filter to one tag key before totalling anything.
Showback before chargeback
- Showback. Publish the per-tag totals so each business unit can see what it consumes. No money moves. Most organizations start here and stay there for a quarter or two.
- Chargeback. Bill the totals to the cost center. This only works once the tag data is trustworthy, which is the job of the tag catalog and inventory screens.
An Unknown bar of any size is unallocated cost. It is the single most useful number on this screen when you are starting out, because it tells you how much of the estate nobody has claimed yet.
Why multi-tag allocation makes showback credible
A single virtual machine allocates independently to its business unit, its owner, and its operational category. That is shared cost distribution across several accountable parties rather than an arbitrary assignment to one of them, and it is the reason a team receiving a showback figure can usually agree with it. The cost of that design is the row multiplication described above.
Reconciling against the provider invoice
This report is also where ingested costs are compared against what the provider actually billed, with the variance surfaced rather than silently absorbed. If the number here and the invoice disagree, that gap is visible on this screen.
Because SaaS and licensing spend arrives through the Cloudability endpoint and allocates on the same basis as infrastructure, a cloud resource and an on-premise array can appear in the same report against the same business unit tag on the same daily effective cost basis. That is what procurement needs in order to see committed spend allocated the same way as everything else.
Related screens
All Tags is the catalog you clean up to shrink the unknown bucket. Tag Summary drills into a single tag value and lists every resource behind it. Tag Cost Inventory ranks tags by spend and shows how each is trending.