
Go beyond other tools with switch & host capacity planning, easy topology for troubleshooting, and automatic host connections – no manual input required.

Part of the Hybrid FinOps™ Platform
SAN Intelligence is one capability inside Visual One Intelligence’s Hybrid FinOps™ platform — the financial-visibility layer that unifies cost and capacity across your entire hybrid estate. Use it standalone, or as one lens in the complete picture.
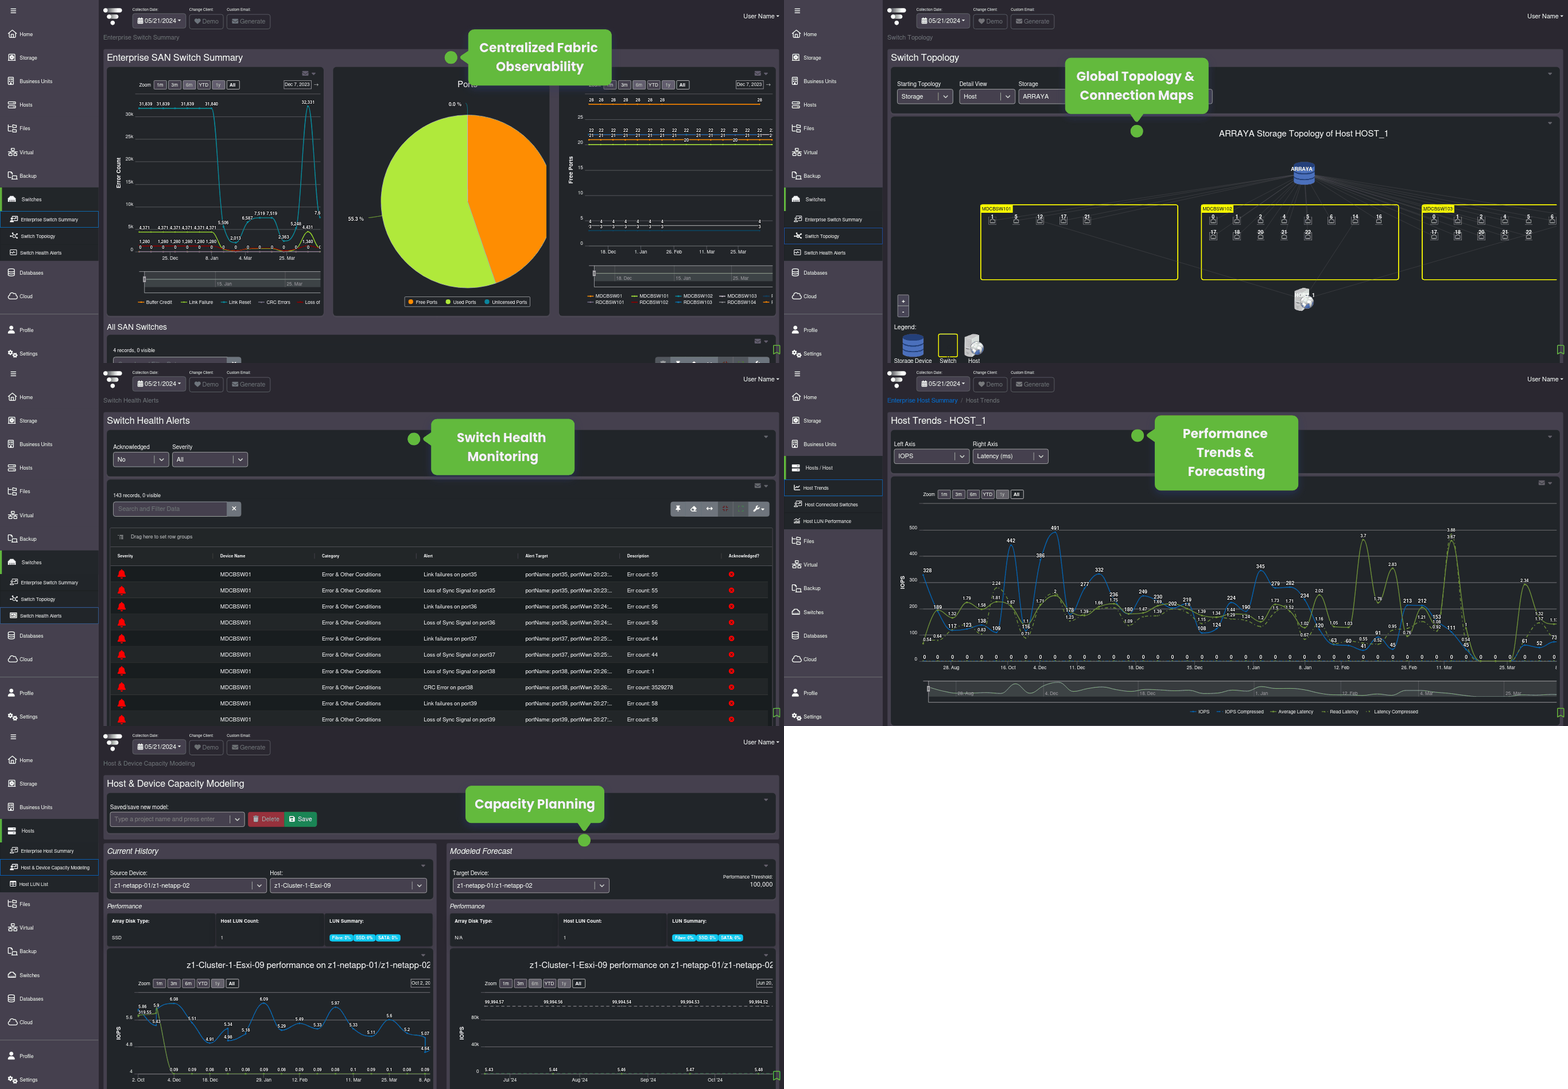
Visual One Intelligence®’s switch topology & monitoring features streamline visibility across Brocade & Cisco switches and hosts through mapping, health, and forecasting details.
The result? Fewer surprises, greater efficiency, and stronger storage ROI.
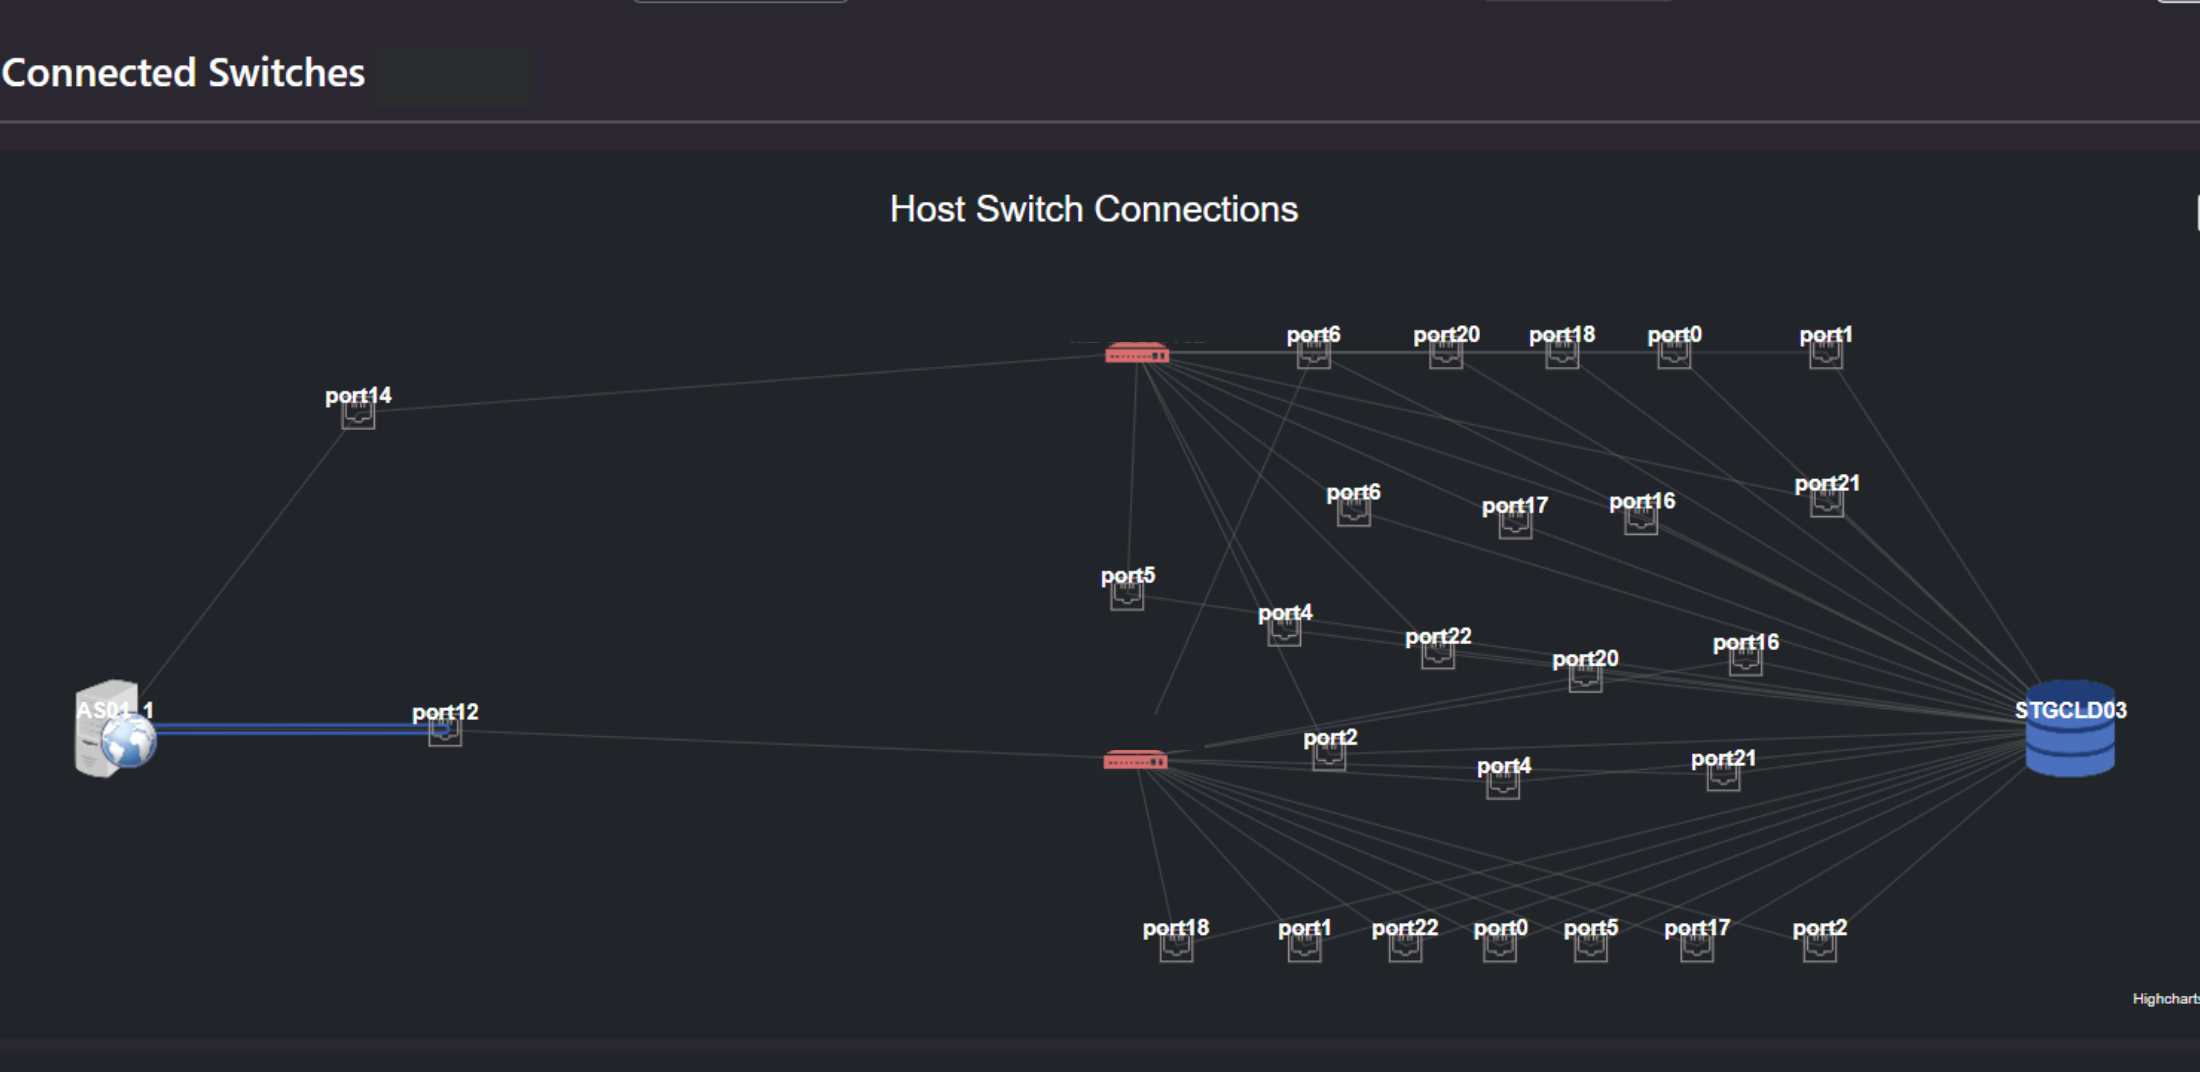
Our global topology maps outline and monitor all of your switch, port, host, and storage connections – no more manual troubleshooting required.
Plus, unlike other switch reporting tools, you don’t need to manually add new host connections. We do it for you!
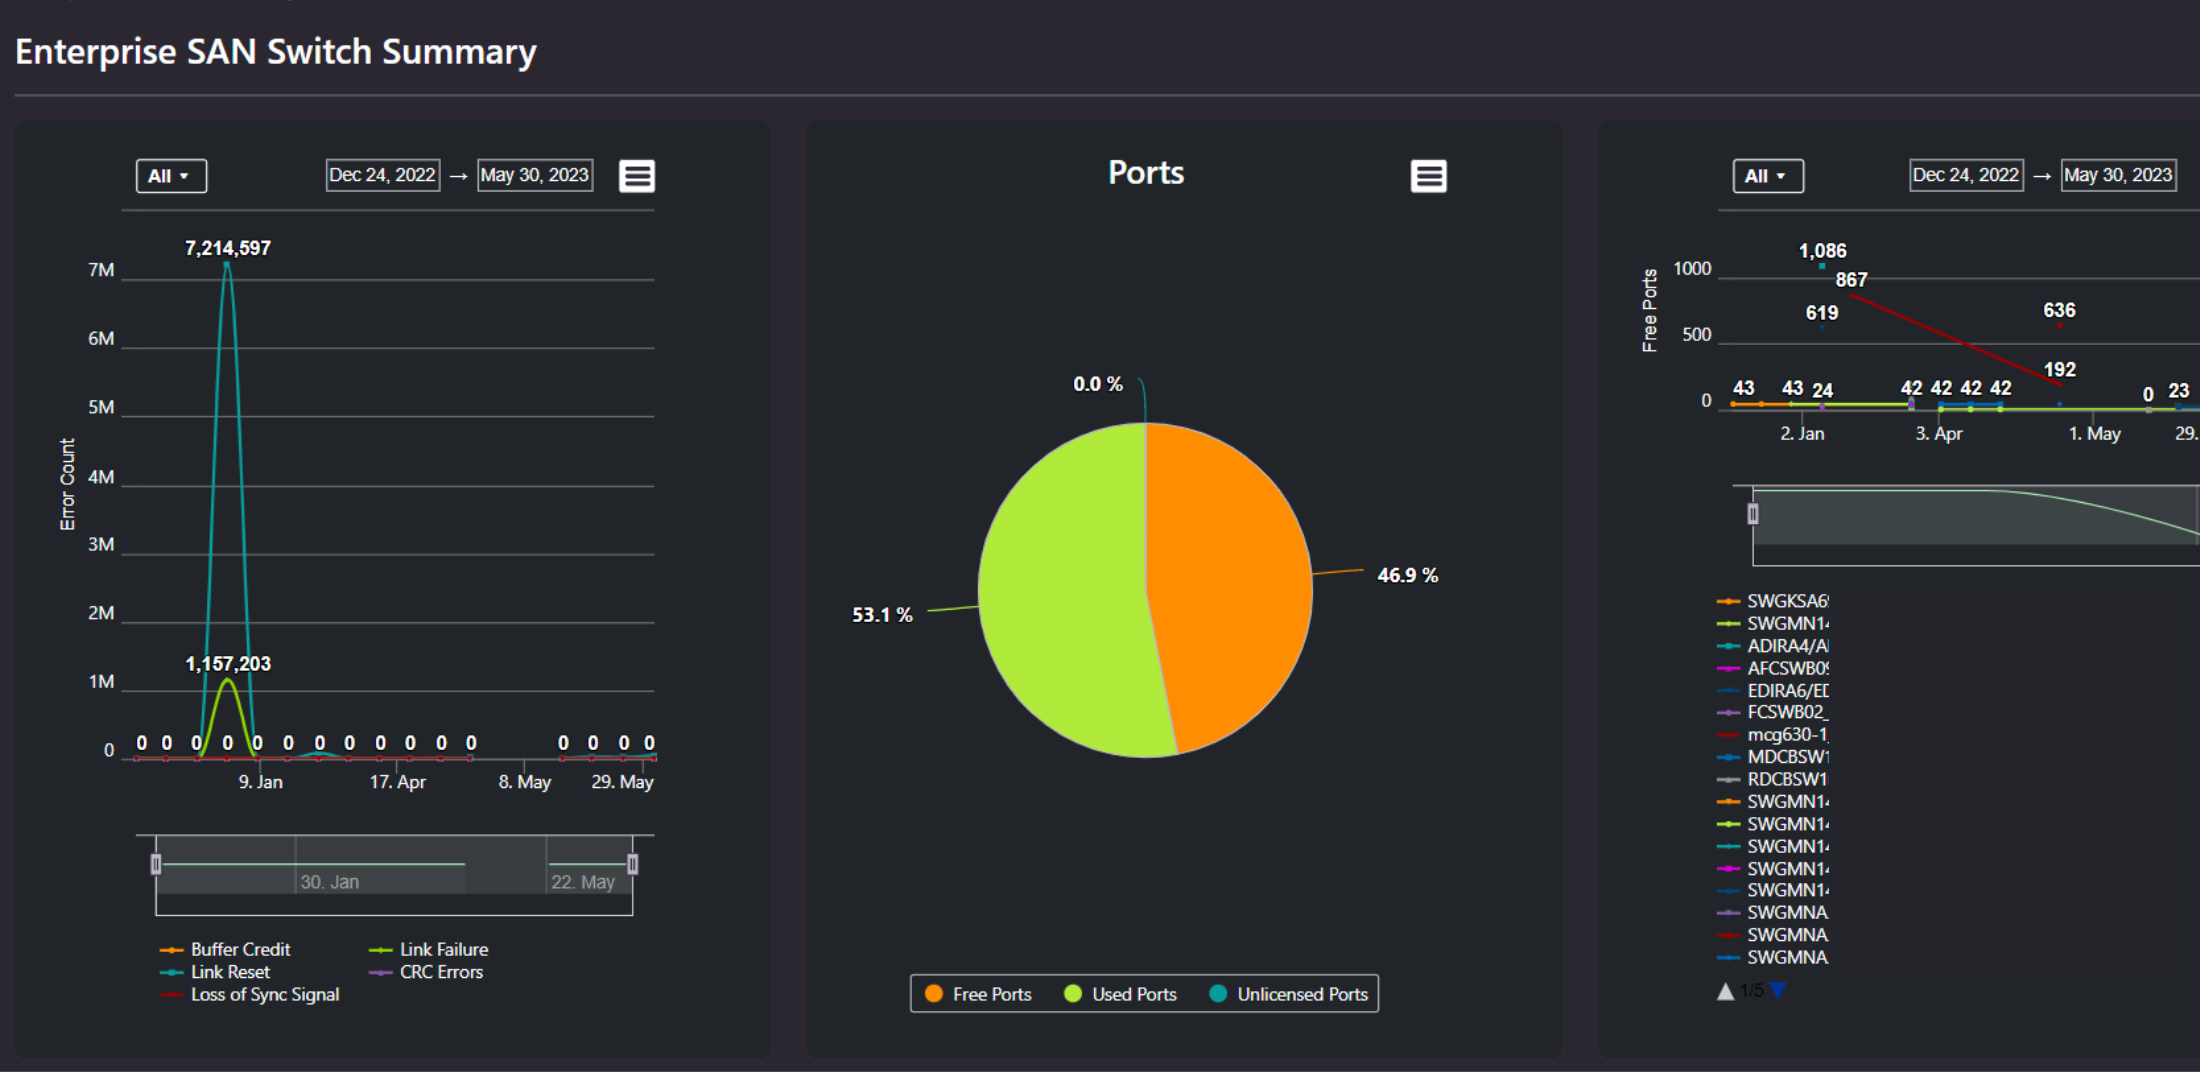
Monitoring and health summaries give you preventative insights into the state of your switches, including root-cause analysis that drills down by port and device.
Our integration with ServiceNow makes it easy to start immediate remediations.
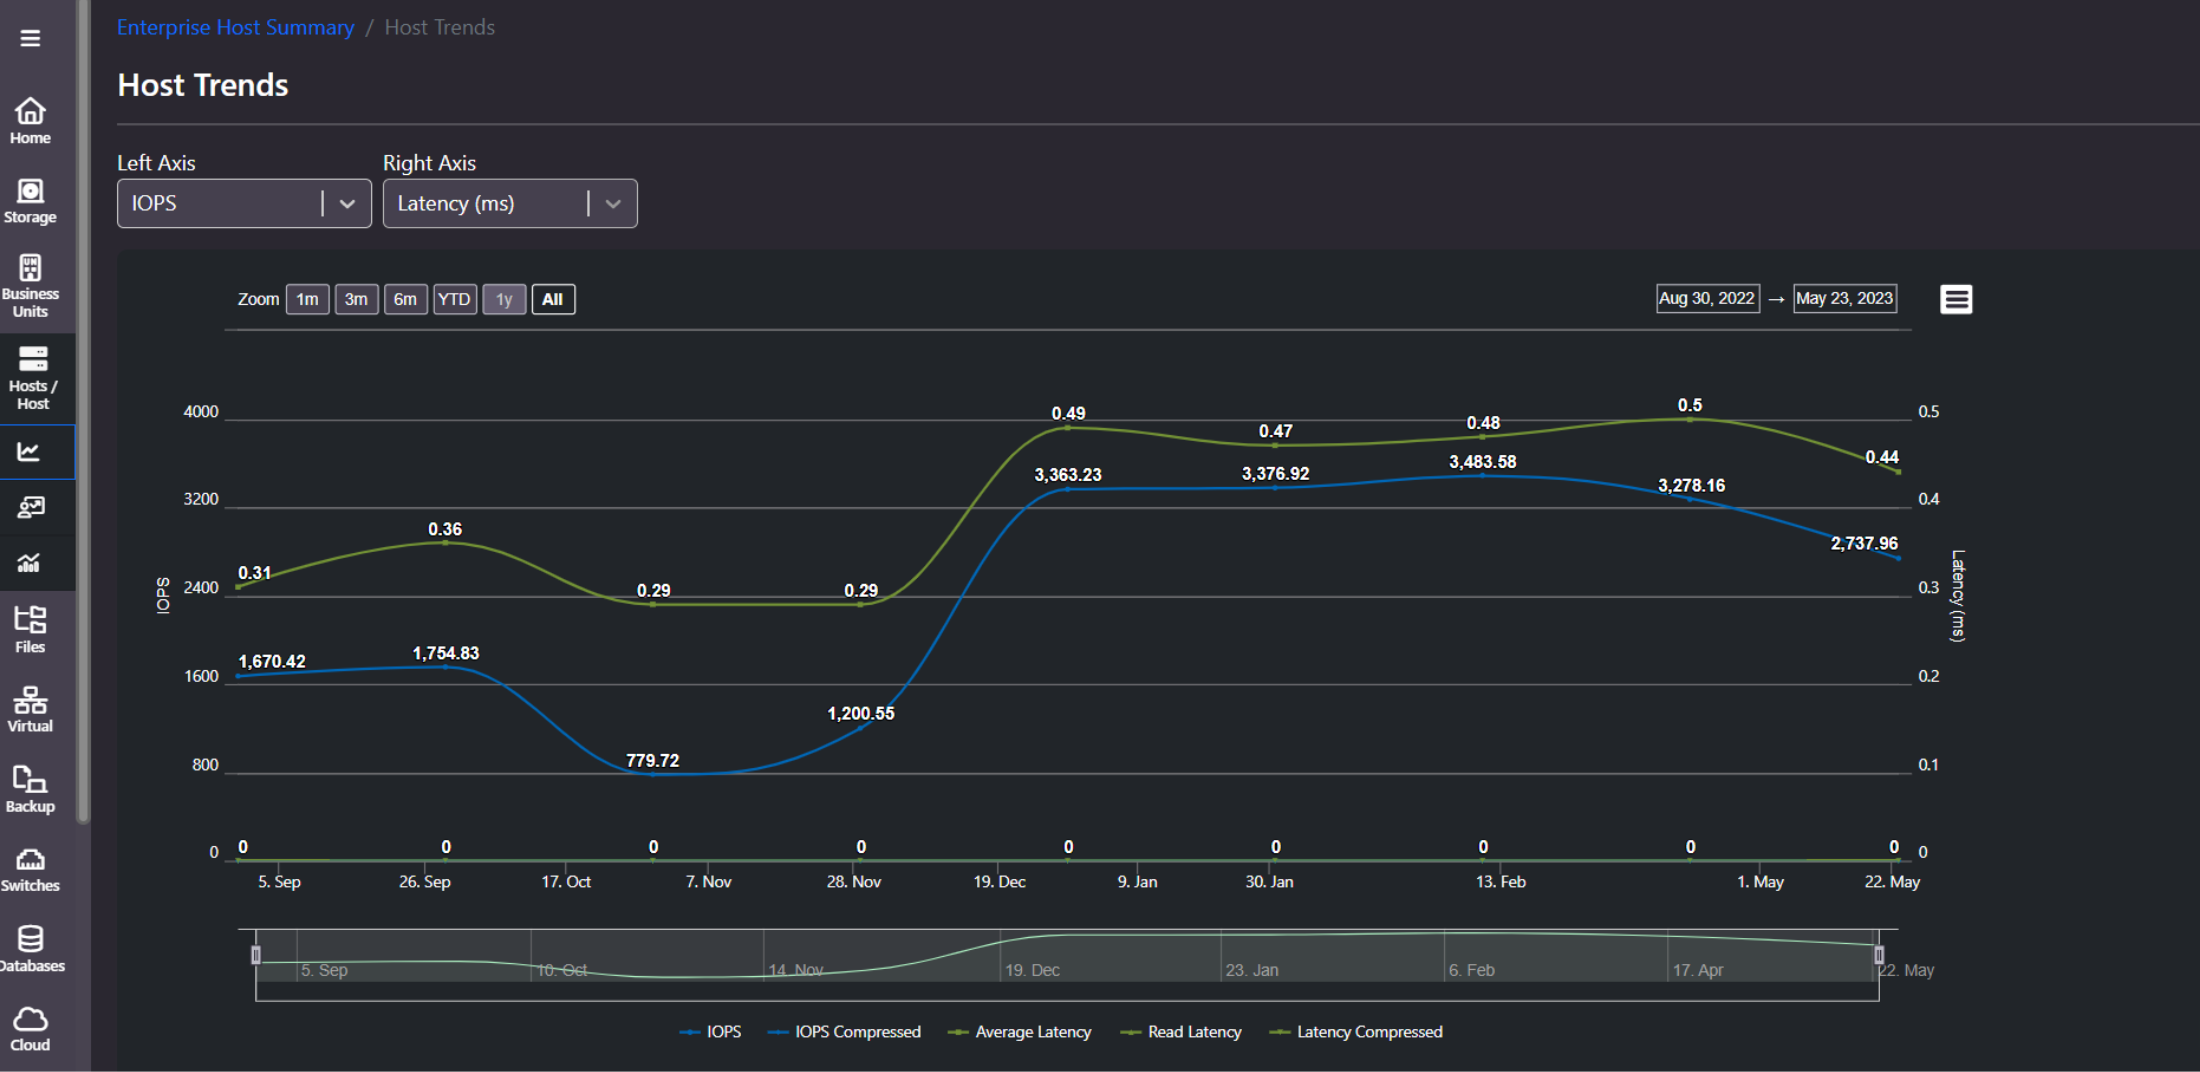
Enhance switch ROI with a full suite of capacity planning abilities.
Rely on automatic end of life / support calendars – plus the option of continued support even after your device’s EOSL
The few products that do exist for switch analytics are typically configured once and then forgotten. Many clients find these other software products cumbersome due to:
Visual One’s data collection is as simple as entering a switch name and authentication to complete reporting setup. That’s it!
We have found that most customers primarily want their switch analytics tool to stick to the fundamentals:
If that matches your requirements, Visual One Intelligence is the tool for you.

SANnav is an ideal tool for setting up large quantities of new SAN switches, defining custom switch policies, and deploying architecture templates across multiple switch environments. However, this niche doesn’t apply to most infrastructures.
Visual One Intelligence features robust switch reporting that:
There are very few software products that include Visual One’s level of detailed analytics: topology visualization, heath reports, capacity planning, error analysis, weekly email efficiency reports, future workload planning, IT asset optimization, centralized observability, budget enhancements, etc.
We consolidate hybrid infrastructures by analyzing everything all together in one place as a single unified system.
Visual One Intelligence® collects and reports data from all Brocade and Cisco SAN switches. To see what other devices we are compatible with, visit this page.
It certainly can be. In enterprise environments, it’s common to work with as many as 20,000 ports (or more). Besides monitoring them all for errors and misconfigurations, it’s important to be able to easily identify what hosts and zones they are mapped to and which ports are unlicensed.
There are not many tools available for this kind of analysis, and as a result many enterprises use SANnav to monitor their SAN environment. However, SANnav can be expensive and complicated – especially for small-to-medium sized environments.
Visual One Intelligence® offers a less expensive, easier-to-use, and more platform-comprehensive option for switch analytics.
SANnav is an ideal tool for setting up large quantities of new SAN switches, defining custom switch policies, and deploying architecture templates across multiple switch environments. However, this niche doesn’t apply to most infrastructures.
Visual One Intelligence® includes robust switch reporting that:
Unlike SANnav, Visual One Intelligence® offers automatic host connection listings, global topology, switch capacity planning, EOL / EOM calendar and continued support, ServiceNow integrations, and more.
Visual One Intelligence®’s data collection is as simple as entering a switch name and authentication to complete reporting setup. No required software maintenance, firmware prerequisites, latency requirements, additional license charges, custom configurations, or overall complexity.
For a full technical overview of Visual One Intelligence®’s SAN functionality (compared with SANnav’s functionality), click here.
Our single-pane-of-glass data displays make it easy for clients to analyze hosts and the ports they are mapped with together. That way, when a host encounters an issue, clients quickly rule out (or identify) a switch-level root cause.
In addition, performance trending and capacity planning help clients monitor usage and ensure they always have enough licensed ports available for their future projects – avoiding last-minute license purchases and budget changes.
Moreover, Visual One Intelligence® provides extensive reporting, modeling, monitoring, and optimizing for nearly all storage environments including SAN storage. Learn more here.
We report on multiple SAN switch data points, including:
For a full technical overview of Visual One Intelligence®’s SAN functionality (compared with SANnav’s functionality), click here.
Yes! With a standard subscription you have full, 24/7 data collection and reporting on everything in your cloud / compute / on-prem environment – including all of our SAN switch visibility and insights.
If a standard Visual One Intelligence® subscription isn’t the right fit for you, Visual Cloud Intelligence is available as a stand-alone offering dedicated solely to reporting in virtualization environments.
Either way, you can try us out free for 30 days.