Share this:
Visual One Intelligence® saves you time and money by providing instant VMware reports detailing virtual performance, utilization, configuration, and spending.
Rapid data growth is driving IT teams to spread storage across cloud, hyperconverged, and edge environments. Gartner’s 2022 Strategic Roadmap for Storage foresees that “twenty-three times growth in shipped petabytes (PBs) through 2030 will reshape and redefine the data center and IT operations as we know them today.”
And virtualization is the glue holding these environments together.
Many teams use native monitoring tools like VMware Aria Operations (formerly vRealize Operations – or vROPs) to keep track of their VMware. But these can be complex and unwieldy, not to mention expensive if not included in your VMware contract. Worse still, lack of visibility can prolong slow performance and risk errors, slowdowns, and even outages. And as IT professionals know all too well, troubleshooting is its own full-time job.
With Visual One Intelligence®, you can avoid the hassle and reclaim control by accessing VMware reports in three clicks or less. Here’s how.
- Track VM Allocation Costs
- Rightsize VMware Workloads
- Map vCenter Topology
- Do Capacity Planning
- Monitor VM & Cluster Health
- Correlate All Storage on a Single Pane of Glass
Track VM Allocation Costs
Max Clicks: 3
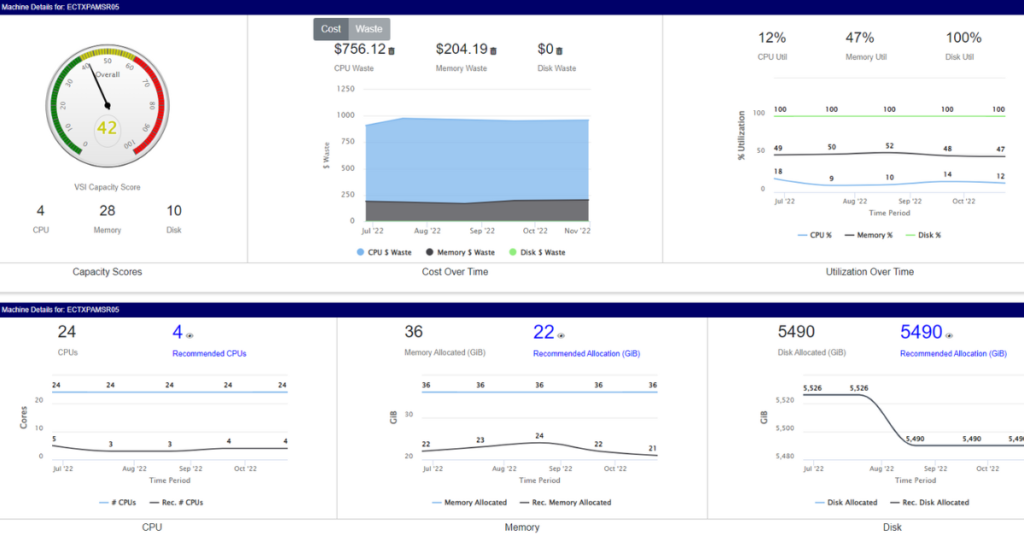
Ever wonder how much a specific VM costs over time? Or – even scarier – the cost of wasted allocations over time?
Visual One Intelligence® shows actual costs and wasted costs for every VM’s memory, CPU, and disk allocations.
It might not be fun to consider, but this is essential information for IT and infrastructure directors.
If you are losing a lot of money on wasted allocations, you could be saving all that money by rightsizing your allocations.
These precise cost metrics provide an instant roadmap to cost-cutting, showing you where to optimize first.
Rightsize VMware Workloads
Max Clicks: 3
Not only will Visual One Intelligence® show you which VMs to optimize first, but it will give you instant rightsizing recommendations on the very same screen as VM cost metrics.
Let’s say you have a VM (pictured below) that costs $907 in CPU allocations but is only utilizing 12% of those allocations. That’s $756 wasted on unused allocations.
Now you want to eliminate that waste (and on dozens of similar VMs), but you don’t have time to calculate the rightsizing for all those VMs yourself. No problem! Just look under the cost metrics to find exact rightsizing recommendations – in this case, a CPU reduction from 24 to 4.
You can even see all utilization and rightsizing data for all your VMs on one simple chart.
It’s that simple.
Map vCenter Topology
Max Clicks: 2
As your storage spreads in more directions, can you visualize how it all connects?
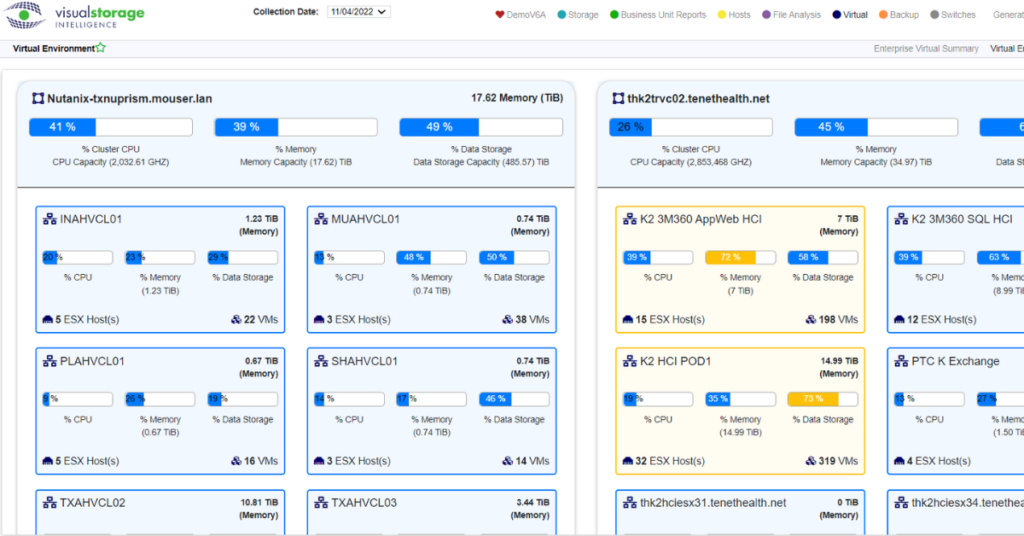
Visual One Intelligence® displays simple vCenter mappings that group each vCenter’s clusters and display utilization details for each. It color-codes each according to how close to capacity it is and displays host and VM counts for each cluster.
Clicking a cluster opens a detailed cluster-level analysis, displaying every host and VM plus important capacity trends.
Do Capacity Planning
Max Clicks: 3
Speaking of capacity trends, Visual One Intelligence®’s VMware dashboards and alerts provide VM build capacities and (for clusters) days left to capacity.
For any cluster, easily forecast future utilization with capacity modeling for CPU, memory, disk, and VM build – including the ability to model hypothetical workload changes.
At the VM level, proprietary capacity scores (numbered 1-100) provide an instant gauge into how well any given VM is being utilized.
Monitor VM & Cluster Health
Max Clicks: 2
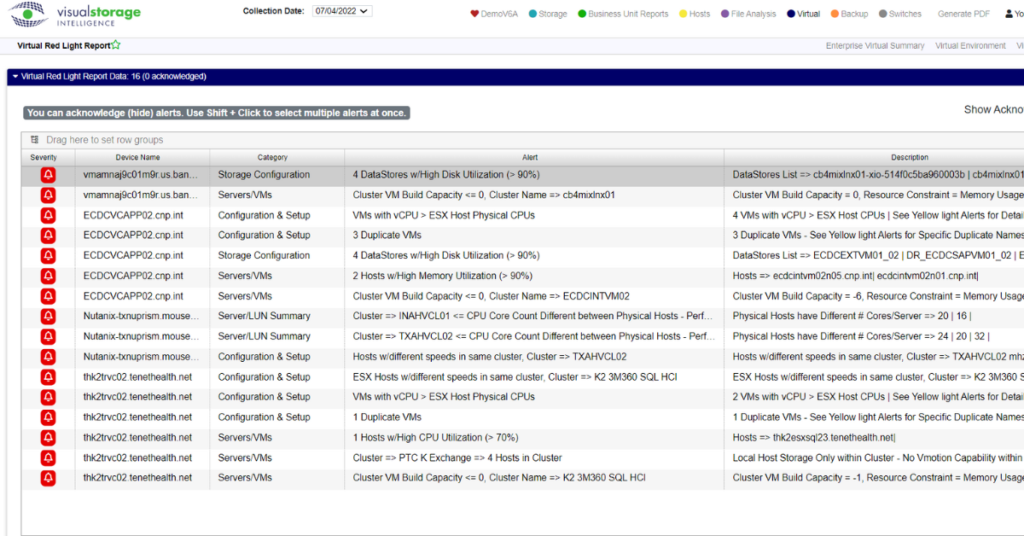
Red-light and yellow-light reports provide instant details and prioritization for dozens of alerts regarding urgent errors and potential risks.
Monitoring aims to prevent problems such as:
- Over-allocations
- Over-utilization
- Configuration errors
- Outage vulnerabilities
By highlighting these risks for you ahead of time in a weekly email, Visual One Intelligence®’s virtual assistant makes it easier than ever to prevent problems and maintain a healthy virtual infrastructure.
Correlate All Storage on a Single Pane of Glass
Most importantly, Visual One Intelligence® doesn’t just provide VMware reporting. It gives full observability into your entire storage environment, correlating all your physical, virtual, and cloud storage data on one screen.
Wouldn’t it be nice to stop relying on multiple vendor tools – plus your own spreadsheets or custom-built reports?
With Visual One Intelligence®, you can see everything altogether in one place.
And since seeing is believing, we want to let you see how it works in your own environment. Reach out today to request a free two-month unlimited trial and start applying insights as soon as this week.
No cost, no obligation. Just insight.


