
Share this:
Why the gap between the cloud console and the physical rack costs more than the hardware.
Your AWS Outpost arrived six months ago. It’s racked in the cage next to your Pure FlashArrays and your Nutanix nodes, running workloads that can’t leave the building. The console says it’s healthy. Your storage team has never logged in. Your virtualization admin doesn’t know it exists. And nobody can tell you, right now, how much raw capacity is left on the physical rack versus how much you’ve already carved up for tenants.
That last gap is the whole problem. The number exists. It just lives somewhere none of the usual tools look.
The console shows a cloud. The rack is a data center.
AWS built the Outposts console to feel like the rest of AWS: EC2 instances, EBS volumes, CloudWatch graphs, and a green “Available” badge. From the console’s point of view, the Outpost is one more Availability Zone. That works fine, right up until you ask a question the cloud model was never built to answer.
How full is the physical rack? The console shows the volumes you’ve provisioned. It doesn’t show the physical capacity underneath them, and that’s the number that decides when “add another workload” becomes “issue a purchase order.” AWS does publish it, in CloudWatch, on a dashboard somebody has to build. Unless a person went looking for it on purpose, it’s on nobody’s screen.
Which volumes are orphaned? The console lists volumes by Availability Zone. It won’t tell you which ones are attached to nothing, billing since the last migration, serving no workload. Unattached volumes can sit there forever until an administrator hunts them down. That’s true on every platform, cloud or on-prem; the difference is whether anything is watching. Mostly, nothing is. Harness, in its 2025 FinOps in Focus report, found that only 39% of teams have real-time visibility into unused or orphaned resources.1 From the moment that waste starts accruing, identifying and eliminating it takes an average of 31 days.
Why are some instances missing memory metrics? Is that a configuration gap or a monitoring failure? You can’t tell from the console. CloudWatch doesn’t report memory or filesystem usage on its own; that takes the CloudWatch Agent inside each instance. Without the agent, the console shows nothing. And nothing looks exactly like zero. At 2 a.m., that’s the difference between “ignore” and “page someone.”
You ask these same questions about every platform on the floor. With the Outpost, though, the cloud tools treat it as cloud and the floor team treats it as someone else’s problem. The device falls into the gap between them, and the gap is wide enough to hide real money.
Every vendor names the same thing differently
This is where mixed-environment monitoring gets frustrating, and it has nothing to do with AWS specifically.
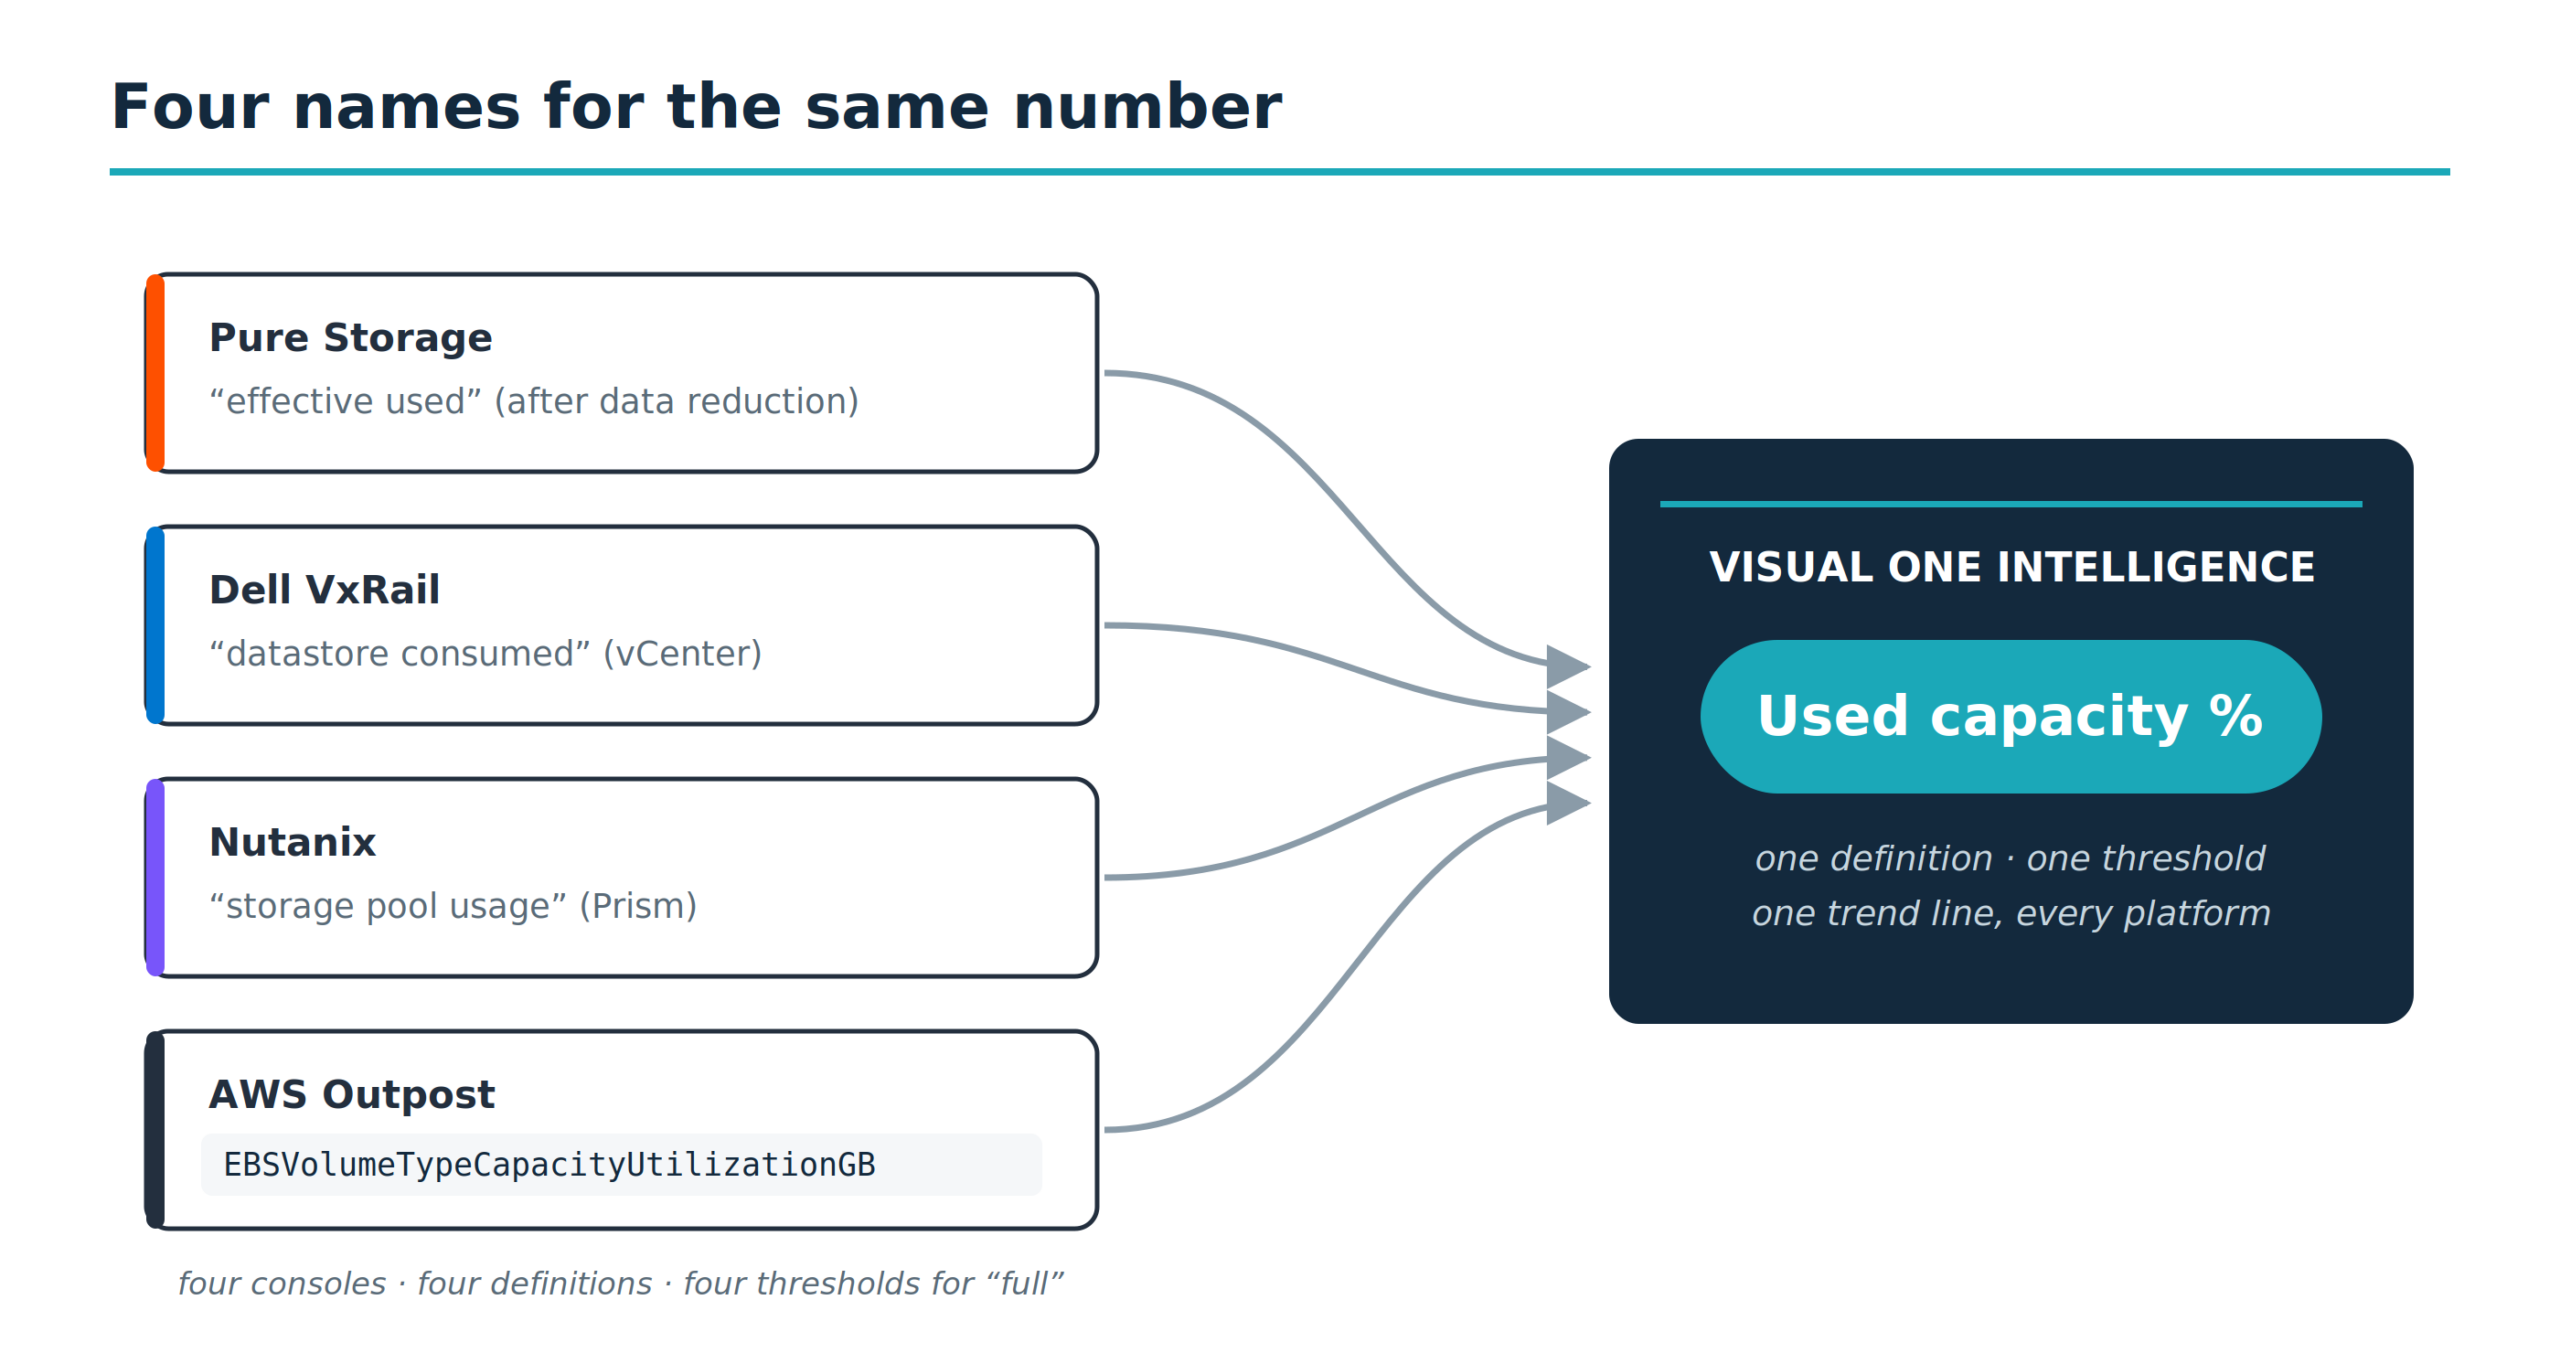
Your Pure array reports capacity as used, available, and effective. Your VxRail cluster reports datastore capacity, provisioned versus consumed, with VMDK-level detail underneath. Your Nutanix nodes report storage capacity in TB with a separate physical-usage figure. The Outpost reports EBS volume sizes, per-instance-family utilization, and rack capacity as a CloudWatch metric in gigabytes per volume type.
Same concept. Storage capacity. Four vocabularies, four definitions of “used,” four thresholds for “full,” and three of the four consoles behind credentials your storage admin doesn’t have.
The translation problem isn’t cosmetic. When someone asks “how much free space do we have,” the answer depends on which screen they’re standing in front of. When leadership asks how much runway is left before procurement lead times become a risk, the answer is a spreadsheet stitched from four sources, by hand, stale before the meeting starts. Now multiply that by IOPS, latency, memory, snapshots, and health. The blind spots stop being a mystery.
The on-prem cloud is still on-prem
Infrastructure teams have started managing Outposts differently than they did two years ago.
Early on, the rack was a cloud outpost. The cloud team owned it, the cloud budget covered it, cloud tools watched it. That held when one rack ran one workload.
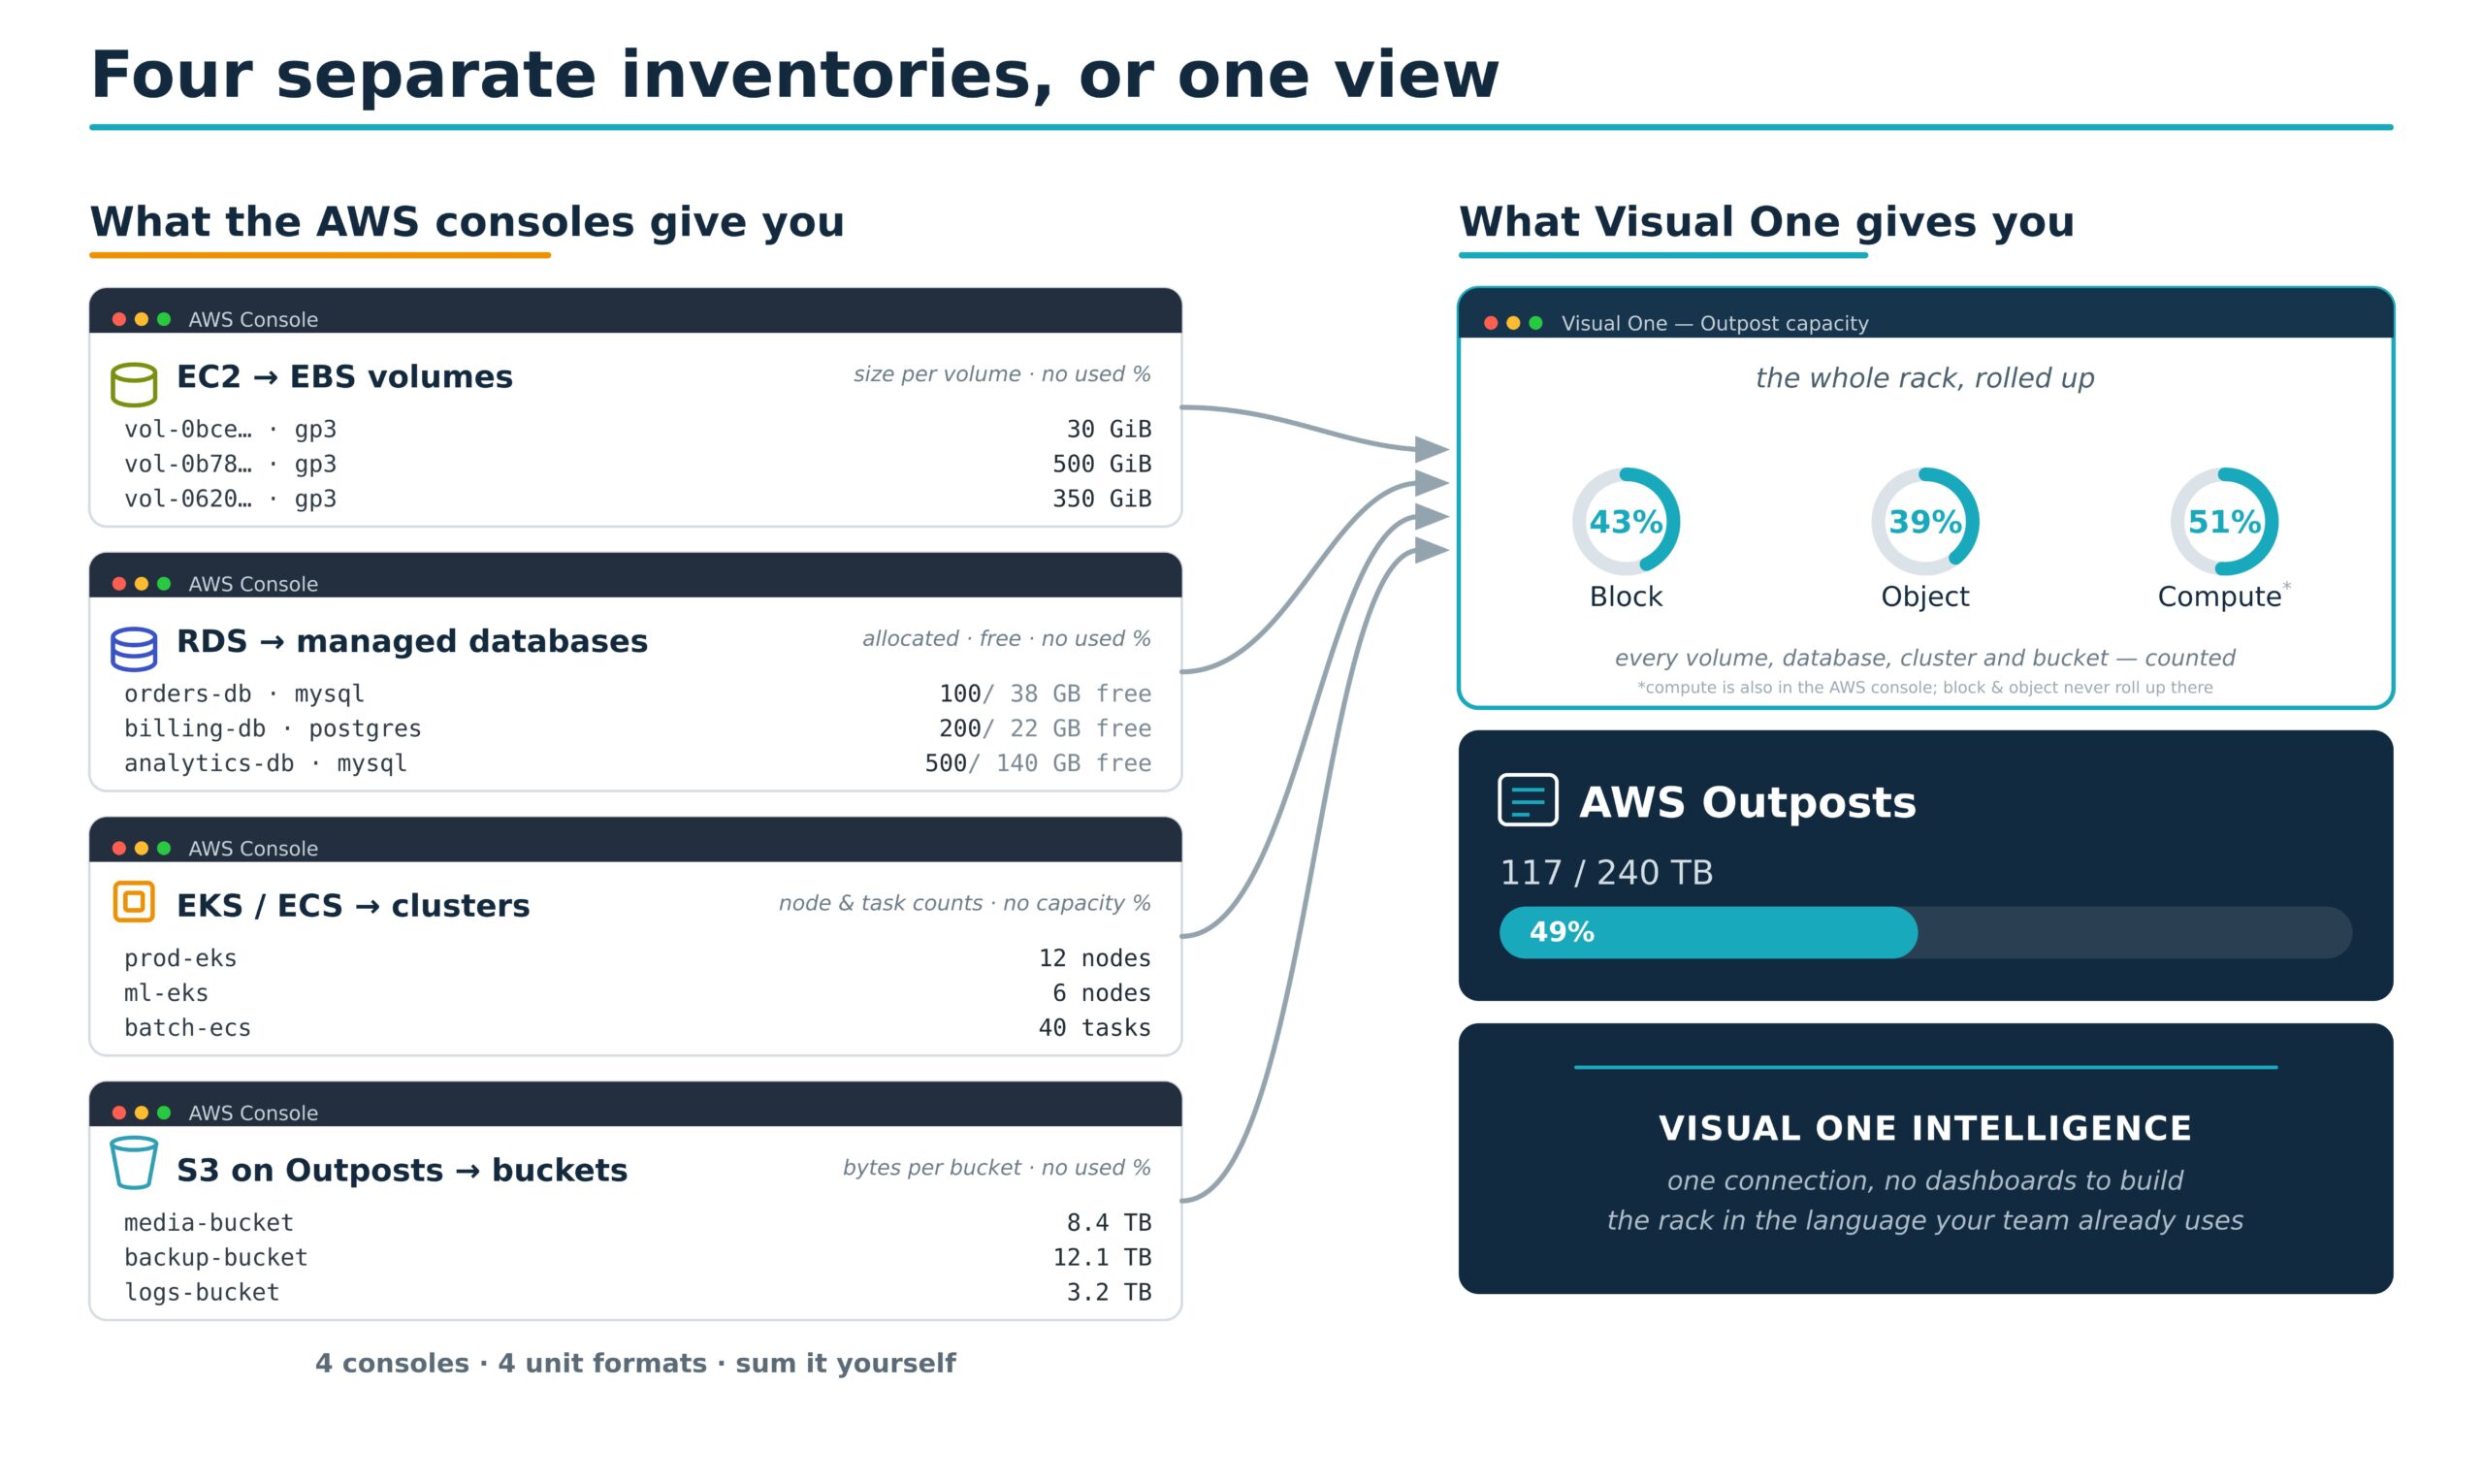
It holds less well now. Teams are adding RDS for managed databases, EKS and ECS for containers, S3 on Outposts for local object storage, and Local Gateway network routing, all next to plain EC2 on the same rack.
At that point the rack stops behaving like a remote Region extension. Compute, storage, networking, a host layer, a storage pool, snapshots, health events, performance counters: that’s a hyperconverged appliance sitting in your data center. The people who own the data center should be the ones watching it, the same way they watch the Dell VxRail or the HPE Alletra two cabinets down.
The framing changes the outcome. Treat the Outpost as cloud and it gets monitored by cloud tools that stop at the console’s edge and rarely reach the physical layer. A cloud dashboard will tell you a volume is slow. It won’t tell you the rack has three weeks of capacity left at the current growth rate. Treat it as infrastructure and it lands in the same dashboards, the same alert rules, and the same capacity model you already trust for everything else.
What containers and object storage add to the blind spot
And the gap is widening, because Outposts isn’t just block storage and VMs anymore.
S3 on Outposts gives you local object storage with the S3 API, provisioned against the rack’s capacity. EKS runs Kubernetes with worker nodes on Outpost EC2 capacity while the control plane stays in-Region. ECS runs container tasks the same way. Each consumes the same finite physical pool, and each reports through a different AWS surface.
Think of the rack as one box with three meters bolted to the outside. The S3 meter watches a fixed allocation you sized when you ordered the rack; it doesn’t budge when block storage fills up, and block storage doesn’t budge when it does. The EKS console counts pods and nodes, not the EC2 capacity those nodes drain from the same box. ECS counts tasks the same way. Each meter is honest about its own slice. None of them shows the box.
Run Tanzu on vSphere or Karbon on Nutanix and the hyperconverged platform already folds container consumption into the same capacity view as the VMs. Outposts doesn’t. The Kubernetes layer, the object layer, and the block layer each report in isolation, and reconciling them into one number is manual work nobody planned for.
What falls through the gap
None of what follows will surprise anyone who manages physical storage. What’s surprising is how scattered the source data is, and how little of it reaches the people who need it.
Rack-level capacity isn’t in the console view. This is the number that decides when you start the next purchase order, and an Outpost expansion is a procurement and logistics exercise measured in weeks. The console foregrounds the sum of provisioned volumes, which says nothing about what’s left on the rack. The real figure sits in CloudWatch, split per volume type, waiting for someone to assemble it.
And over-provisioning is the norm, not the exception. Lucidity’s State of Cloud Storage 2026 report, drawn from enterprise block-storage assessments across AWS, Azure, and Google Cloud, put average cloud disk utilization at roughly 30%.2 Most provisioned capacity is paid-for headroom doing nothing, and you can’t manage a number your tooling never shows you.
Orphan detection isn’t part of the storage workflow. The console lists volumes; it doesn’t flag which are unattached, for how long, or at what cost. AWS does have checks that can surface unattached volumes, Trusted Advisor and AWS Config among them, but those are cloud-team tools behind cloud-team credentials, not alerts in the storage team’s weekly review. On a small deployment that’s a rounding error. At scale it compounds: avoidable cloud waste has held stubbornly steady for years, and almost no organization escapes it entirely.
Health is fragmented, not consolidated. The console rolls health up to a single status, but the real picture is spread across multiple services: connectivity in one place, per-asset hardware and lifecycle state in another, maintenance and event notifications in a third. The data exists. The unified picture doesn’t. Unless someone correlates the signals by hand, the rack’s true health never reaches the team that owns the floor.
Latency exists per volume, not across the rack. AWS publishes average read and write latency for individual volumes, and you can chart or alarm on any one of them. What it doesn’t give you is the number a storage team reads first: the rack’s latency as one device, on one trend line, next to the arrays. That view you assemble yourself, or you operate without it.
Snapshot growth isn’t surfaced as a capacity-planning trend. And snapshots are not an edge case. They’re AWS’s default backup mechanism for EBS, automated through Data Lifecycle Manager policies. On an Outpost they can be stored locally, where they draw from the rack’s fixed S3 allocation. That consumption never shows up in bucket metrics. Delete a snapshot and the capacity takes up to 72 hours to come back; AWS’s own guidance is to set CloudWatch alarms so you don’t run out.3 A daily snapshot policy with no cleanup stays invisible until it surfaces as a capacity shortfall.
Capacity isn’t the only planning problem, either. A rack in your building has constraints in-Region services don’t: hardware refresh cycles, maintenance windows, and expansion lead times measured in weeks. In-Region you click a button for more capacity; on an Outpost you start a procurement. Storage teams already run that planning discipline for every array on the floor, and the Outpost belongs in the same plan.
Normalization is the actual product
Anyone can script the CloudWatch API into a spreadsheet. That’s a weekend. The part that changes how a team operates is normalization: translating the Outpost’s metrics into the same language, units, and severity model the rest of the floor already speaks. CloudWatch is the telemetry source, not the assembly.
Done properly, an EBS volume reads as a datastore. An EC2 instance reads as a VM. The rack reads as a storage array with usable capacity, used, free, IOPS, latency, and throughput, in the same terms as the FlashArray in the next cabinet. EKS worker consumption, ECS tasks, and S3 on Outposts capacity resolve against the same physical rack, so the picture reflects everything drawing on it.
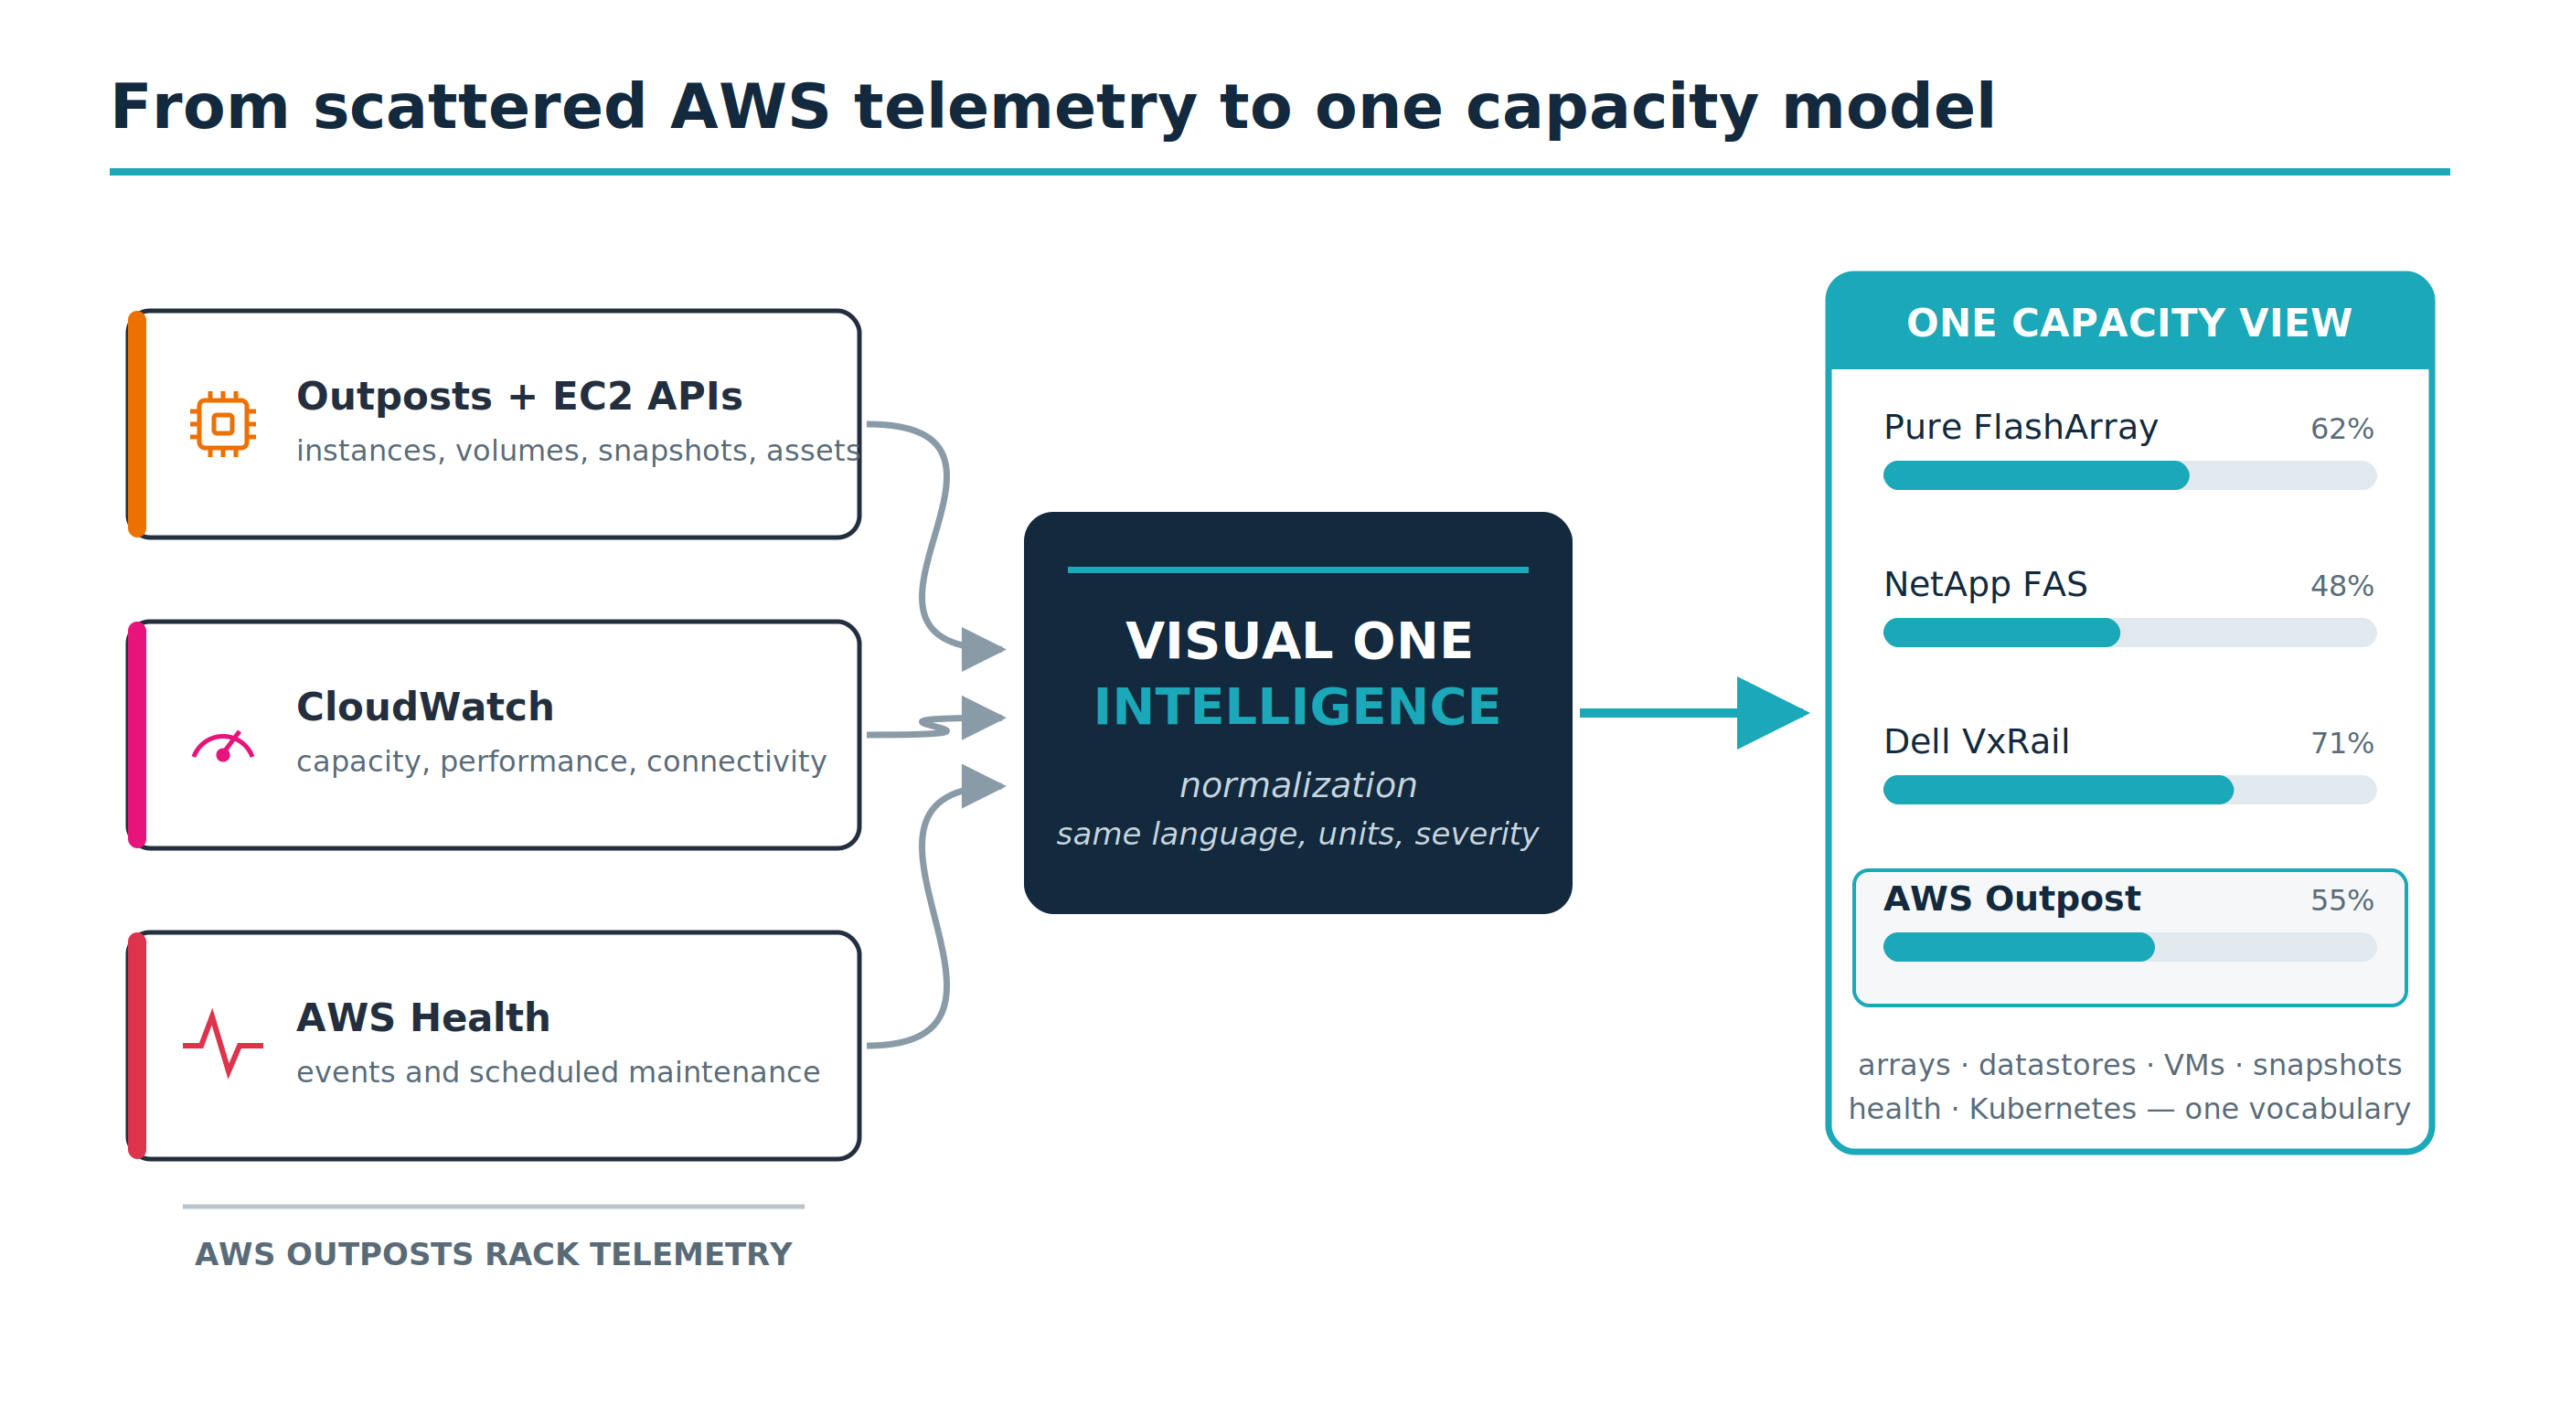
The payoff: a storage admin who has never opened the AWS console can read the Outpost next to every other device. One place, one vocabulary, one trend line. The rack shows up beside the NetApp FAS and the Unity. Its orphaned volumes appear in the same review that flags over-provisioned LUNs. Its health alerts use the same scale as the SAN. And capacity planning stops requiring someone to reconcile four portals into a two-week-old spreadsheet.
Questions infrastructure leaders are asking
Why not just use CloudWatch?
CloudWatch is the telemetry source, not the assembly. The raw counters, capacity figures, and connectivity state are all there. What isn’t there is the work of turning them into one operational model: deriving the metrics a storage team actually reads, pulling the scattered health signals together, and normalizing it all against the other platforms on your floor. You can build that. Most teams don’t, because the gap isn’t painful enough to fund until the shortfall arrives.
Does this replace AWS monitoring or sit alongside it?
Alongside. CloudWatch stays the source. What changes is who can read it: storage and virtualization teams see the same data in the platform they already use for Pure, NetApp, and VxRail, without translating through the cloud team.
How does it handle multi-account Outposts?
Through standard AWS cross-account patterns: CloudWatch cross-account observability, IAM roles, or AWS Organizations. The monitoring account gets read-only access to each member account’s metrics. One integration, one normalized data set, however many accounts share the hardware.
The bottom line
The gap between the console view and the data center floor isn’t a defect. AWS built the console to abstract the hardware, and for in-Region EC2 that abstraction is exactly right. For a physical rack in your building, it scatters the operational picture across CloudWatch, AWS Health, and Outposts-specific APIs, precisely where infrastructure teams need one consolidated view.
The fix isn’t another dashboard. It’s the same fix that worked for every platform that arrived with its own console and its own definition of “used”: normalize it into the framework your team already trusts, and let the rack speak the same language as everything else on the floor.
Your Outpost is infrastructure. Monitor it like infrastructure.
Visual One Intelligence reads your AWS Outpost the same way it reads Pure, NetApp, Nutanix, and VxRail — one view, the metrics and terminology your team already uses, no AWS console required.
Sources
- Harness, FinOps in Focus 2025, https://www.harness.io/finops-in-focus.
- Lucidity, State of Cloud Storage 2026, https://lucidity.cloud/.
- Amazon Web Services, “Amazon EBS local snapshots on Outposts” and “Managing S3 on Outposts capacity,” AWS Documentation, https://docs.aws.amazon.com/AWSEC2/latest/UserGuide/snapshots-outposts.html.