
Share this:
Posted in:
Efficiency & OptimizationThe goal of storage optimization is to minimize your storage investments while maintaining your service level agreements to your end users and customers. Financial challenges often appear to be in direct conflict with the technical challenges – resulting in meeting your financial goals while sacrificing service levels, or meeting your technical goals, but over spending to do so.
There is plenty of data to assist in the process to meet both requirements, however, the data is often from multiple sources and in different formats, making it hard to normalize the data and facilitate the decision-making process in the time frame required. Visual One Intelligence® does just this – integrates and normalizes all the data and delivers it back to you in a single location and through a series of visual reports that guide users to make informed decisions rapidly and confidently.
The Challenges with Storage Optimization
Oftentimes the first issue clients face when attempting to do storage optimization is where to perform storage optimization. At the storage array level? At the Data Center level? At the Enterprise level? At the Business Application level?Most clients pick only one of these levels and therefore become optimized within that level, but sub-optimized at all other levels. Of course, the ideal approach would result in optimization at all levels, but without the right reporting and analytical tools this is impossible.
The next challenge is understanding what items are going to be considered in storage optimization. These are items like performance needs, special feature usage (compression, deduplication), waste management (space fragmentation, orphaned Space, snap shot space, space efficiency savings), tracking & forecasting information for future planning.
Because there are a variety of complexities to consider, it can sometimes be difficult to choose where to begin your storage optimization process. For us, a “bottoms up approach” has always seemed the simplest and most efficient way to solve and manage this process.
Optimizing Your Storage Environment with Visual One
Step 1: Review, Analyze & Optimize your overall Enterprise Storage Environment
This might seem obvious, but often times this step is skipped or just assumed to be ok. What I mean by reviewing and optimizing your storage at an enterprise level is to NOT look at storage array details in this step but to review:
- How much storage do I have at each location?
- How much of the storage is Used vs Available?
- What “type” of storage do I have at each location?
- High Performance vs. High Capacity?
- What are my trends for each of the above items and based on trends, where do I need to take action to continue to provide optimal storage service to my customers.
Most organizations have more than one data center where storage is located, so initially it is important to have an understanding of storage by data center and also see the trends across each data center. This is important to not just verify that the storage exists, but that it is also the right kind of storage.
What happens if this information is not readily available?
Allocation of storage on whatever exists. This is where your optimization strategy begins to fall apart. Allocating storage to applications which only need low performance storage on existing high-performance storage – because that is what is available – results in wasting some of the most precious storage resource (high-performance storage) with low performance needs applications.
Two weeks later this is a forgotten event and so the storage is never reclaimed for high performance applications. Of course, this event does not happen just once – it happens over and over again which just servers to reduce storage optimization and costing more over time due to waste.
How Visual One Intelligence® Can Help
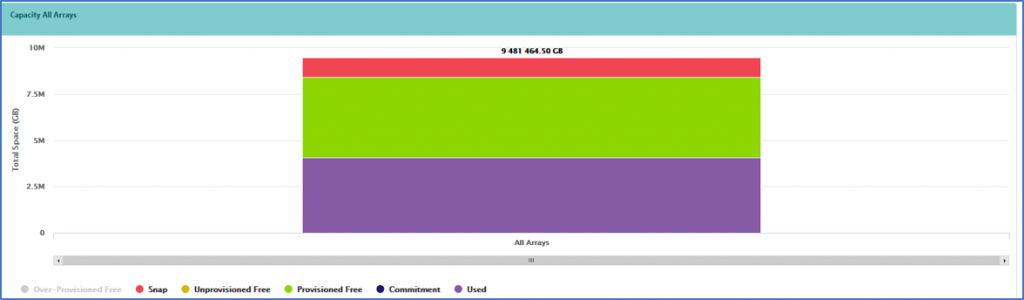
The Enterprise capacity summary chart shows how much space snapshot data is taking of the customers overall total space used. In the report below we see 200 TB of Orphaned space that could be reclaimed and re-provisioned to avoid additional storage purchases. We also see 545 TB of Snap Shot space – there may be portions of this space that can be reclaimed and repurposed as well.
 Enterprise Capacity Example 1
 Enterprise Capacity Example 2
 A Array Total Array Capacity Example 3
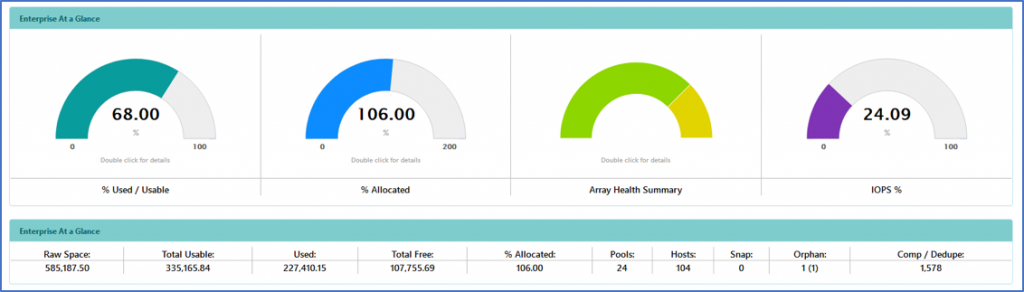
Enterprise Summary Scenario 2
In the Enterprise Summary example below, a small customer shows 355 TB of usable space and this space is spread across 7 arrays. The current freespace is 107 TB (roughly 1/3 of available space is free)
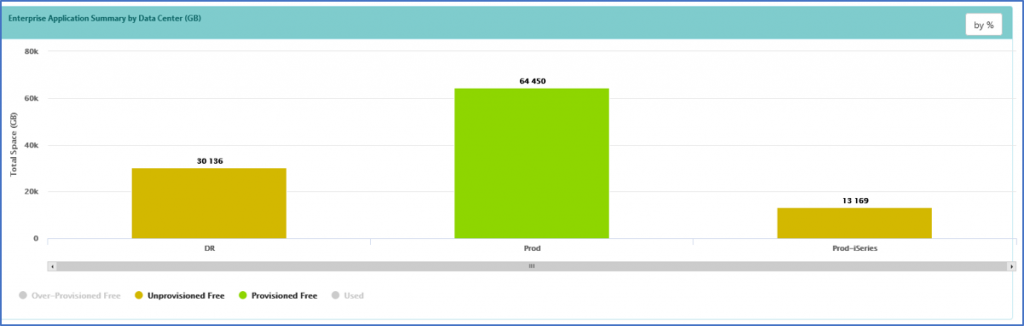
The next logical questions to ask are: Where is the freespace and what type of storage is available each location?
The storage by data center charts show this data, which in this example reveals I have 64 TB in production, and 30TB in my DR data center. The production environment is over provisioned, so this freespace shows as provisioned (allocated), but still not used.
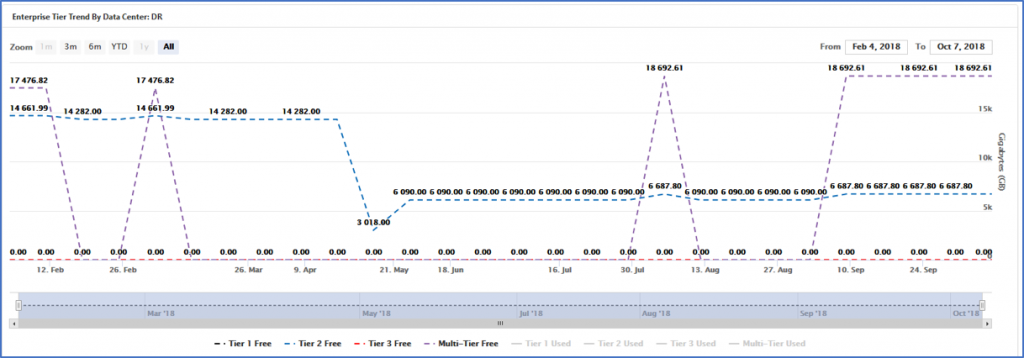
The storage by tier by data center chart shows that only Tier 2 (SAS) or multi-Tier (SSD/SAS) is available. No Tier 1 (SSD) or Tier 3 (SATA- this type of storage is not available at the DR Site). Being able to access this information quickly and see trends allows the appropriate level of planning to occur in order to purchase or allocate the right type of storage for each application within the enterprise- thereby lowering overall cost of time and maximizing efficiency.
Enterprise Free Space by Array
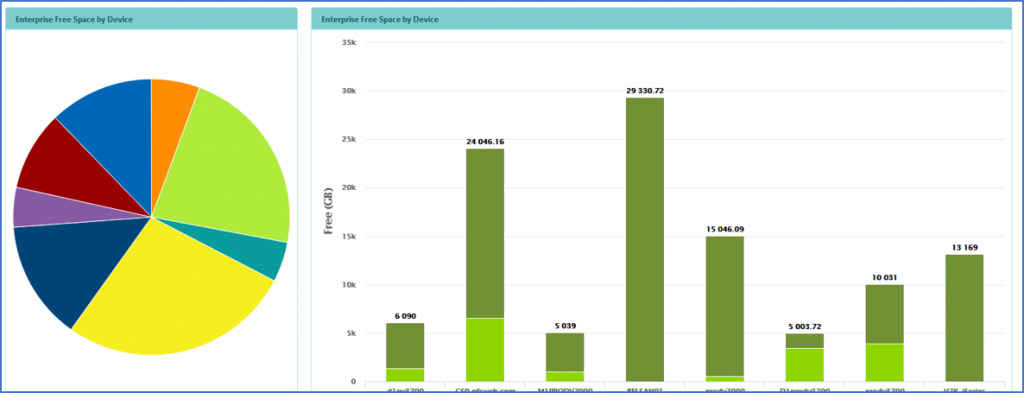
The chart above shows free space by array. The pie chart can be used for fragmentation analysis. What we see from this visualization is there are a number of arrays with under 10 TB of free space, making them unlikely targets for new storage allocations. By removing these 4 arrays under 10 TB, I would reduce my overall free space by 26 TB and now I would only recognize 80 TB split across 2 data centers. This analysis revealed specific storage upgrades for Tier3 storage were needed to remain optimized across the enterprise and to improve overall performance by relocating some applications previously on Tier 2 to be on Tier 3.
Step 2: Optimize Storage Usage with each Storage Array
The next step in the process is to drill down one level into each array and make sure storage arrays themselves are properly configured. This step might appear to be tedious, especially depending on the number of arrays within an enterprise. However, this step can be simplified greatly using the following approach:
Review Enterprise summary by array screen – sort the data by the number of pools within each array.
The more pools that exists – the more space fragmentation that occurs. The general guideline is to keep the number of pools to a minimum.
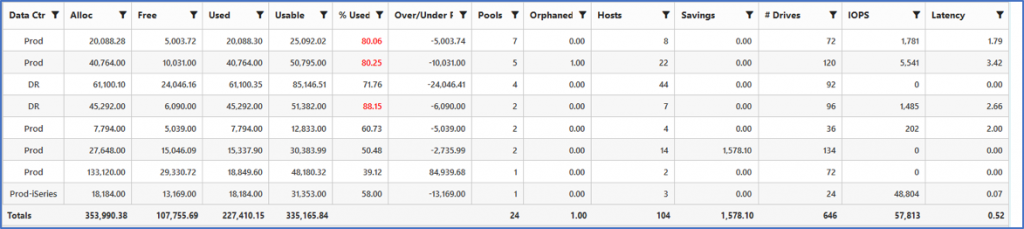
What we see from the above chart is there are 3 arrays with more than 2 pools. We should review pool design in all 3, but we will just analyze the array with 7 pools to determine if there are opportunities to improve efficiency within this array. The same analysis should be performed on all arrays where a larger number of pools exist.
When we drill into the array specific details, one of the initial charts we see is freespace by storage pool. This chart is often very revealing to customers where the number of pools is greater than 4 pools. We can quickly see from this screen that while the overall freespace was shown to be 5 TB, it actually has ZERO free space. If the array was configured with a single storage pool, the 5 TB of free would have become usable, but the freespace fragmentation is often the unintended result of over configured arrays with more than 4 pools. This is an extreme example because the array itself is small which only serves to compound the issue.
Additional items to consider that are reported at the array level are things like orphaned storage – defined as storage that is allocated but now mapped to any host or file share. Orphan Space is often an overlooked item when performing space analysis because it requires detailed analytics to “discover” what is actively in use and what is not. There may even be cases where storage is mapped but no IO is being performed against that particular storage – Visual One detects and reports both types of orphans.
The last step is to make sure that at a business unit level the right applications and users have been assigned to use the right type of storage. This does require customer input through a variety of techniques where specific hosts, vms or volumes are tagged as being associated with a specific set of applications and users. This is a one-time event and once completed, allows for the reporting, tracking and trending for all storage by application.
The chart above is a simple example where all applications have been tagged and the user can see by storage array where each major application is being supported. Growth and forecasting charts are also available within Visual One so you can see where your growth is coming from, which applications are growing the fastest and by how much, what types of storage is needed by each application, which data centers and storage arrays need additional capacity and which can be reconfigured to reclaim space no longer being accessed to avoid unnecessary purchases.
Why Visual One:
Visual One Intelligence® provides single pane of glass reporting for all storage arrays, and perhaps most importantly provides both high level views and analysis as well as detailed analysis down to the array, host, and LUN as needed. By organizing this data in a series of simple screens, Visual One allows customers to see and process what is happening in their environment and take action in order to efficiently meet enterprise requirements.